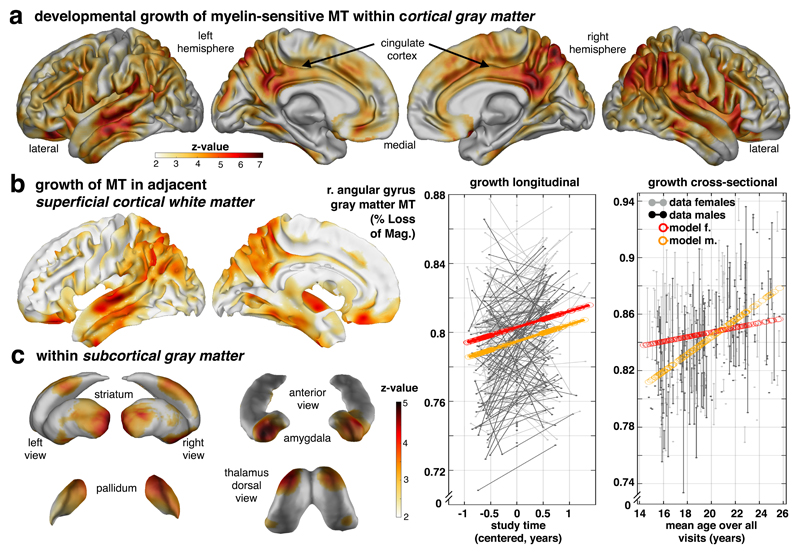
Figure 1. Developmental growth of myelin-sensitive MT into early adulthood.
Transitioning into adulthood is characterised by marked increases in a myelin marker within cortical gray (a), white (b) and subcortical gray matter (c). Statistical maps of voxel-wise MT saturation show increase with time/visit (longitudinal) or age (cross-sectional; for specific effects of covariates, e.g. time/visit, age, sex, interactions etc., see supplementary information). (a) Gray matter MT increase (top row; statistical z-maps from one-sided Wald-test, p<.05 FDR corrected, sampling-based correction reported in Supplementary Table 1, cf Supplementary Fig. 2c, n=497/288 scans/subjects, 51.7% female, sample and test apply for panels a-c) is strongest in parietal, lateral temporal, posterior and middle cingulate, but is also present in prefrontal cortex. Longitudinal model in angular gyrus peak (mean across a 6mm sphere; coloured lines in left data plot; x-axis: relative time of scan) and adjusted data (uncoloured) shows an MT growth in both sexes, with a marked sex difference reflecting greater MT in females (see Supplementary Fig. 3c for region-specific sex differences). Corresponding cross-sectional model predictions in the same region show a similar increase with age (right data plot; y-axis: MT; x-axis: mean age over visits). (b) MT growth in adjacent cortical white matter is most pronounced in cingulate and parieto-temporal cortex with a coarse topographical correspondence to the gray matter MT effects. (c) Subcortical gray matter nuclei express MT age effects in striatum, pallidum, thalamus, amygdala and hippocampus (cf Fig. 2a-b). This growth is most pronounced in amygdala, ventral (max z-value voxel [z=4.81, p=.004 FDR], [MNI: 20 13 -11]) and posterior (z=4.47, p=0.004 FDR, [MNI: -31 -19 3]) striatum suggesting ongoing myelin-associated changes in both cortical and subcortical brain structures.

