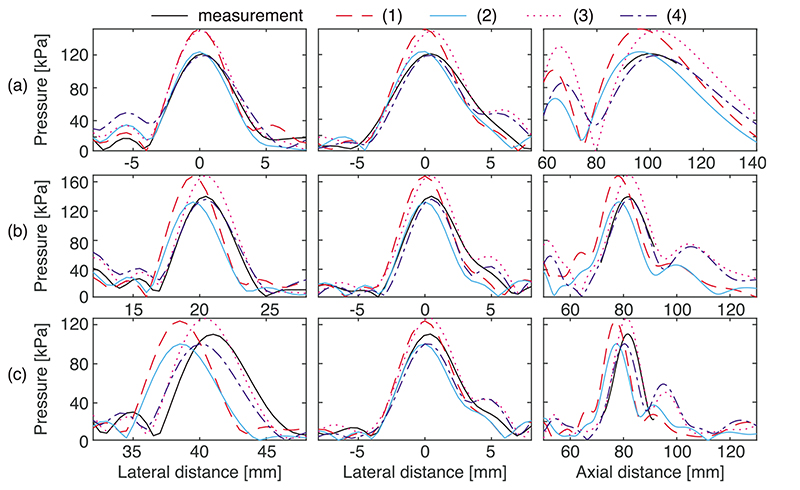
Fig. 2.
Lateral (left, middle) and axial (right) line scans passing through the focus of the measured (black line) and simulated fields with four different parameter combinations steered to (a) 0, 0, 100 mm, (b) 20, 0, 80 mm, and (c) 40, 0, 80 mm. (1) Nominal element size and positions, uniform source pressure; (2) optimised size, nominal positions, crosstalk prediction; (3) nominal size, measured positions, uniform source pressure; (4) optimised size, measured positions, crosstalk prediction.

