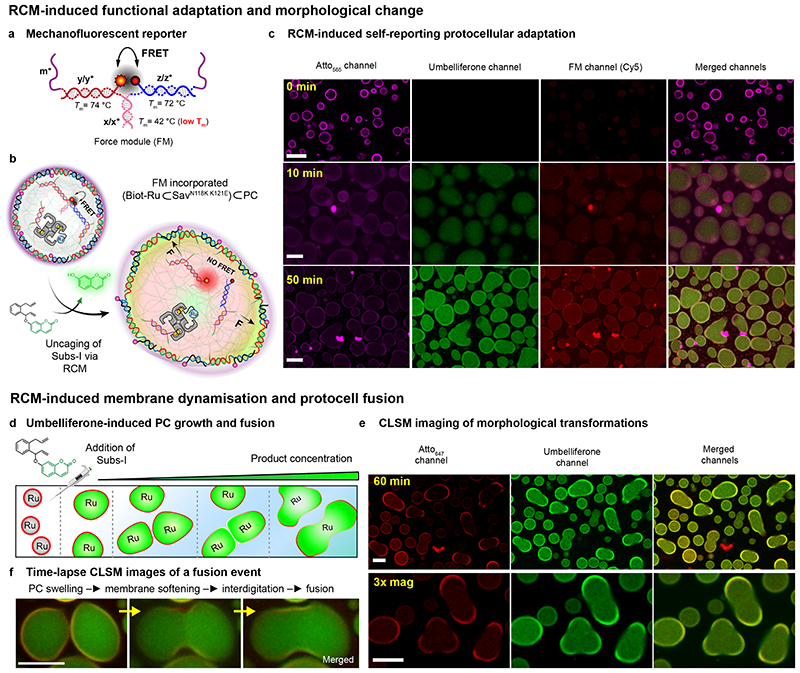
Fig. 5. RCM-induced, self-reporting, downstream functional adaptation and morphological output.
(a) Structure of the mechanofluorescent force-sensing module (FM). The red-emitting fluorophore (Cy5) and the quencher (Iowa RQ) are in close proximity, thus quenching the red fluorescence by FRET. The FM has two m* domains, which are used to cross-link the PC core at core barcodes m. The double-stranded x/x* is the weakest link (−ΔGy/y* = 25.8 kcal mol−1 > −ΔGz/z* = 25.2 kcal mol−1 > −ΔGm/m* = 24 kcal mol−1 > −ΔGx/x* = 9 kcal mol−1) in the FM. Homogeneous loading of such FMs was confirmed by functionalization with a FM without the quencher (Supplementary Fig. 10). (b) Schematic representation of the FM-loaded active PCs ((Biot-Ru⊂SavN118K K121E)⊂PC), in which 70% of the barcodes (m) inside the PCs are used for catalyst loading and 30% are used to attach the FM. RCM-induced uncaging of umbelliferone triggers PC swelling and FM activation as revealed by red fluorescence. (c) Time-dependent CLSM. The magenta channel represents the Atto565-n* conjugated PC shells; the green channel reports on the uncaging of umbelliferone inside the PC core, and the red channel reveals the second fluorescent output from the dissociated FM. The isolated fluorescent “hotspots” are contamination, while the PC interior turns homogeneously red. (d) Schematic representation of RCM-induced morphological transformation in PCs. The PCs undergo swelling and membrane rupture and PC fusion upon increasing the concentration of the Subs-I. (e) CLSM images of swollen and fused PCs after 60 min following Sub-I addition. (f) Time-lapse fusion event of protocells. Larger overview in Supplementary Fig. 11. Scale bars: 5 μm. 3x mag: three times magnified. For the fusion experiments, [Subs-I] = 0.6 − 0.8 mM, 10 mM phosphate buffer, pH 6, 0.1 M MgCl2.

