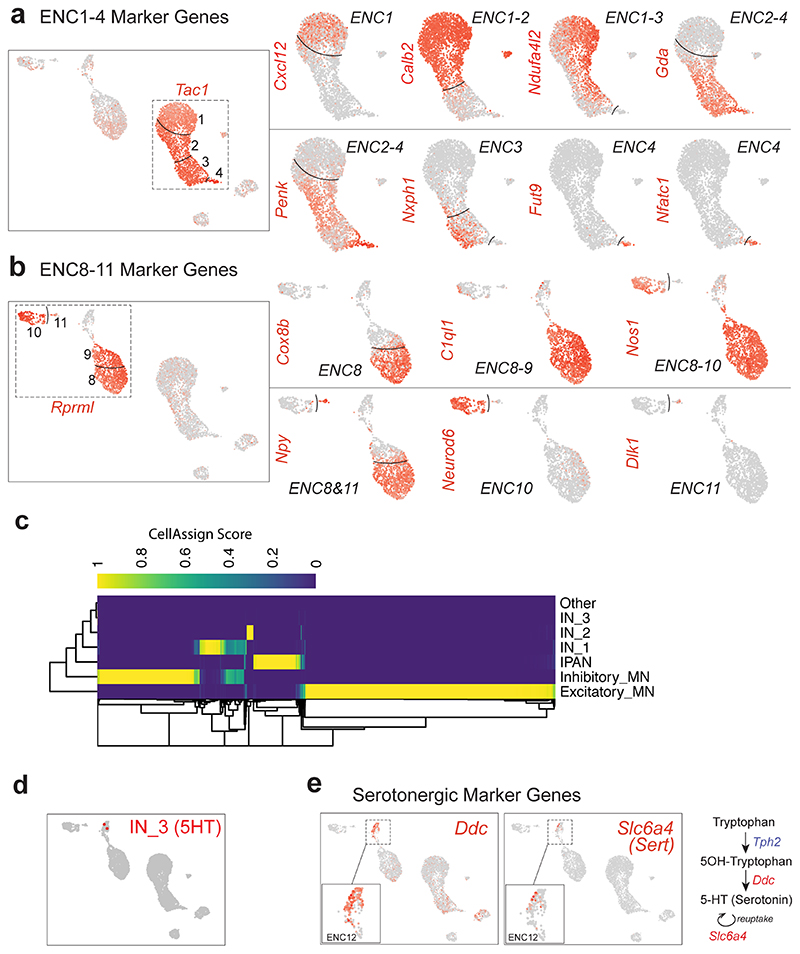
Extended Data Fig. 2. Supportive data related to Figure 1h-j.
a) Feature plots related to Tac1+ clusters (ENC1-4). A gene set including Calb2 and stronger Ndufa4l2 demarcated ENC1-2 from ENC3-4, while Gda and Penk expression discriminated ENC2-4 from ENC1. ENC4 resembled ENC3, but displayed a unique expression of Fucosyltransferase 9 (Fut9) and the transcription factor Nfatc1. b) Feature plots related to Rprml+ clusters (ENC8-11). c) Heatmap representing CellAssign score for each cell (columns) to each functional type (rows). d) Rare cells assigned with maximum likelihood to interneuron 3 (IN_3, serotonin-producing), presented on UMAP. e) Feature plots displaying expression of genes correlated to serotonin production (Ddc) and re-uptake (Slc6a4) in ENC12.

