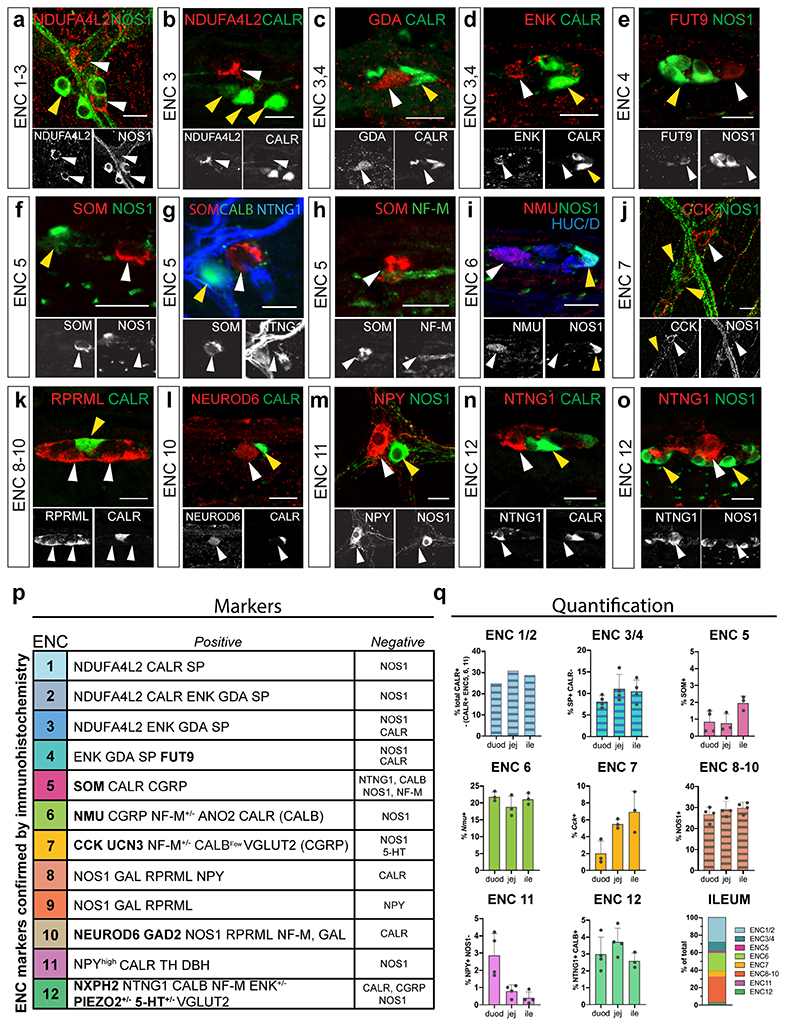
Extended Data Fig. 3. Negative markers for ENC1-12, summary table of validated ENC markers and ENC proportions across the small intestine.
a-o) Immunohistochemical validation of negative marker proteins. Pictures show either myenteric peel preparations or transverse sections at P21-P90. white arrow: positive marker; yellow arrow: negative marker. Scale bars indicate 20mm. p) Table summarizing ENC markers verified by immunohistochemistry (unique markers in bold) q) Graphs indicating proportions of ENCs at week 9-12 (n=3-4 mice) using HUC/D or PGP9.5 for total neuron counts. ENC1-2 was calculated by subtracting CALR+ ENC6, ENC5 and ENC11 percentages from the average total CALR+ neurons. Note the much higher proportion of ENC6 in tissue, than in scRNA-seq data, reflecting the difficulties in isolating big size neurons from tissue. Graph with all ENCs in ileum was normalized to 100% (absolute value 102,6%). Data are presented as mean values ± SD.

