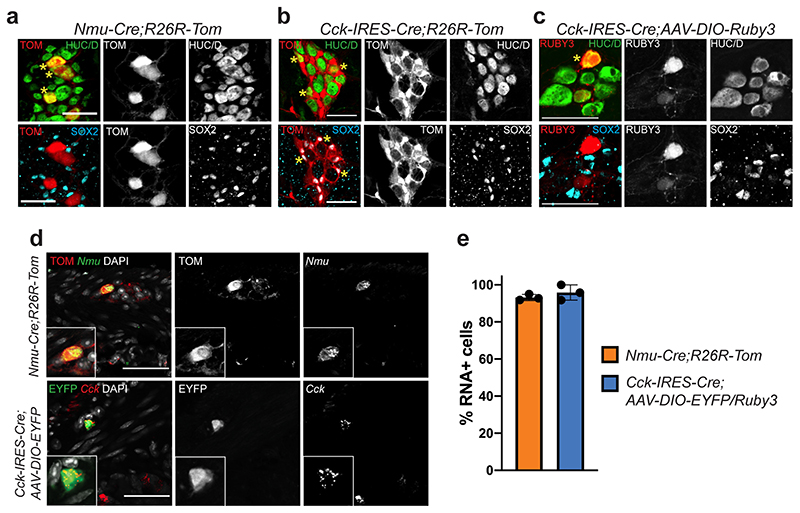
Extended Data Fig. 5. Validation of Cre mouse lines for the investigation of ENC6 and ENC7.
a) Myenteric plexus peel from Nmu-Cre;R26R-Tom mouse showing TOM in HUC/D+ neurons (stars) and its exclusion from enteric glia (SOX2+). b) Myenteric plexus peel from Cck-IRES-Cre;R26-Tom mouse showing TOM in both neurons (stars) and enteric glia (stars). c) Myenteric plexus peel of Cck-IRES-Cre mouse injected with AAV-DIO-Ruby3 showing RUBY3 only in neurons and not in glia. d) Transverse sections showing that Nmu and Cck RNA expression correlate with reporter+ neurons in Nmu-Cre;R26R-Tom and Cck-IRES-Cre; AAV-DIO-EYFP/Ruby3 animals. e) Graph showing the percentage of reporter+ neurons expressing the reciprocal RNA. Data are presented as mean values ± SD. A total of 638 reporter+ neurons were investigated in three Nmu-Cre;R26R-Tom mice, and 71 reporter+ neurons were investigated in three Cck-IRES-Cre;AAV-DIO-EYFP/Ruby3 mice. TOM: dtTomato. Scale bars indicate 50μm.

