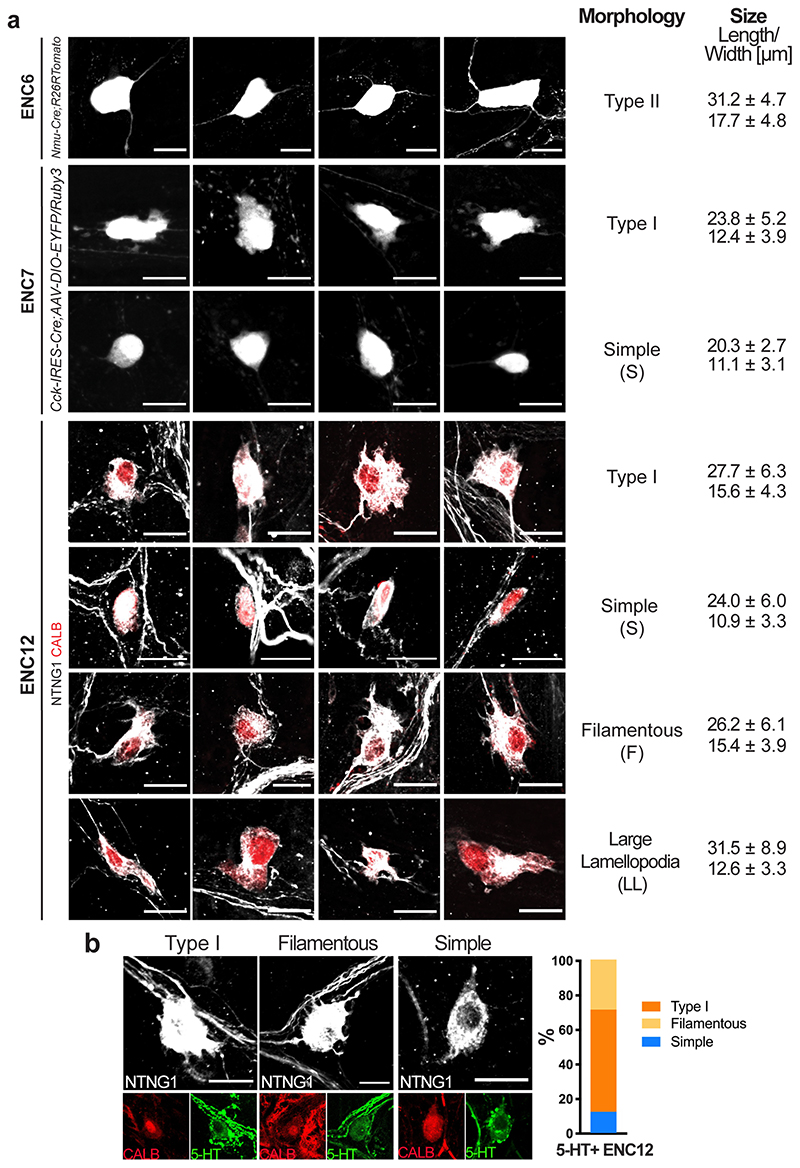
Extended Data Fig. 6. Morphological characterization of ENC6, 7, 12 and 5-HT+ ENC12.
Related to Fig. 4e-g. A) Representative examples of each morphological type found within ENC6, 7 and 12 and their size. B) Representative examples of each morphological type and their relative proportion (n=90 neurons from 5 animals) within jejunum and ileum of 5-HT+ ENC12. Scale bars indicates 20μm. Data are presented as mean values ± SD.

