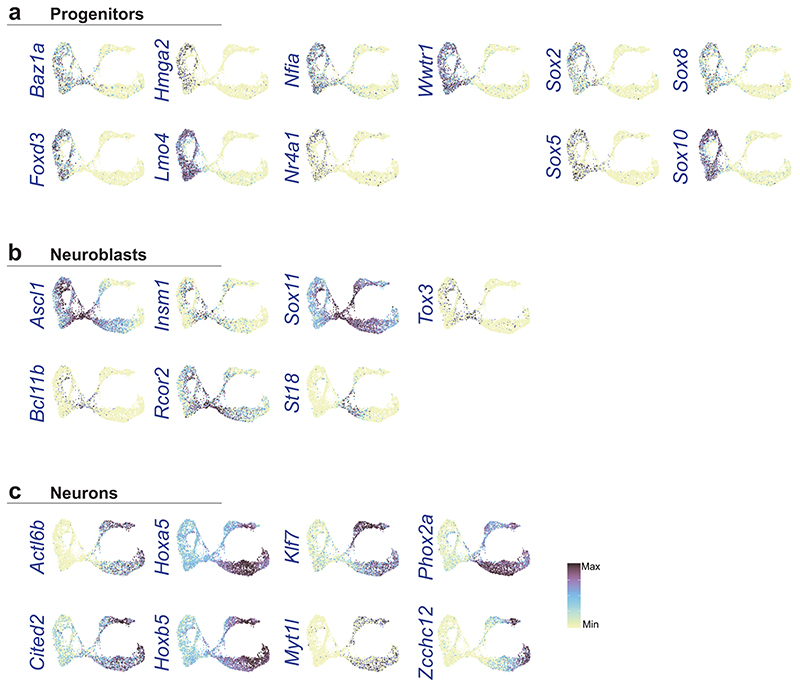
Extended Data Fig. 9. Feature plots displaying transcription factors associated with generic cell states of the ENS at E15.5.
Related to Figure 5f-h. a) progenitors, b) neuroblasts and c) neurons. Color bar indicate expression level with maximum cut-off at the 90th percentile.

