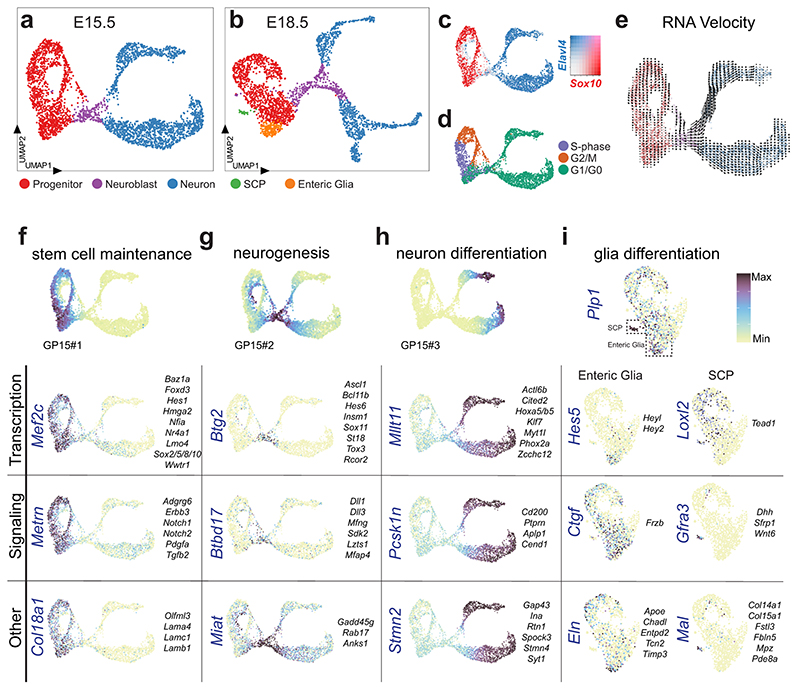
Figure 5. Single cell transcriptome analysis of the developing ENS reveals transcriptional programs of generic cell states.
UMAP of E15.5 (a) and E18.5 (b) ENS scRNA-seq datasets displaying generic states of the developing ENS. c) Complementary expression of Sox10 and Elavl4 reveals progenitor/glia cells versus neuronal populations in UMAP. Color map represents scaled expression of Sox10 (red), Elavl4 (blue), co-expressed (pink) and non-expressing (grey). d) Cell cycle assignment mapped onto UMAP at E15.5. e) RNA velocity analysis on UMAP at E15.5 suggesting the rate (indicated by arrow length) and direction (indicated by arrow direction) of cell differentiation. f-i) Enriched genes organized into categories, with likely functions in stem cell maintenance (E15.5; f), neurogenesis (E15.5; g), neuron differentiation (E15.5; h) and glial differentiation (E18.5; i) plotted on UMAPs. Top of panel displays UMAPs with corresponding gene patterns (GP15#1-3). Vertically written genes are displayed as UMAP for each category, while more genes with similar expression patterns are listed to the right of the UMAP. All transcription factors are displayed as Feature plots in Extended Data Fig. 9. See Supplementary Fig. 4 and Supplementary Table 4 for heat maps and lists of enriched genes, and Supplementary Table 5 for GP15#1-3 indicated in (f-h). Color bar indicates 0-90th percentile expression level. UMAP: Uniform Manifold Approximation and Projection; ENC: Enteric Neuron Class; GP15: Gene Pattern at E15.5.

