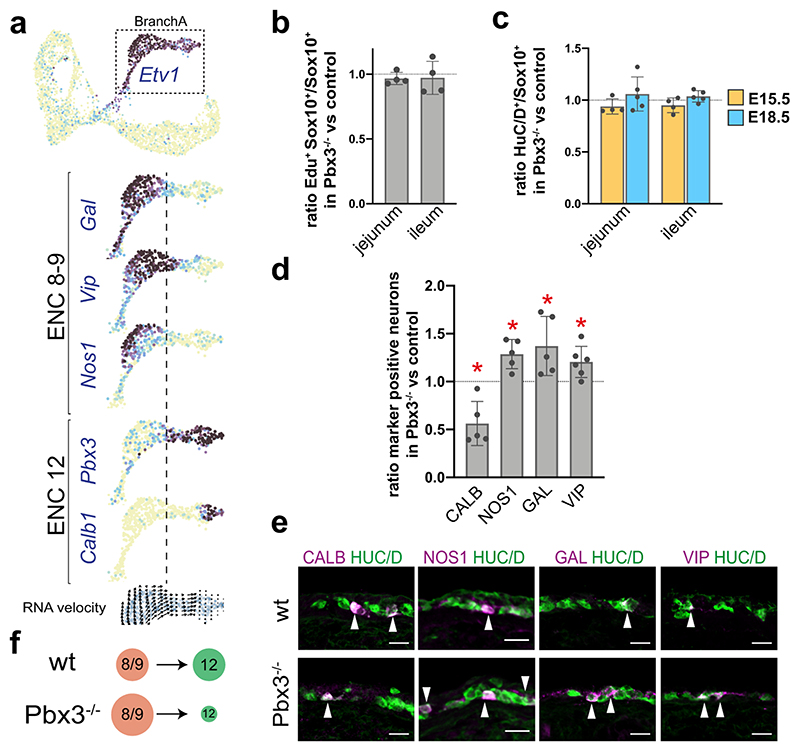
Figure 7. Loss of PBX3 expression impairs the ENC8/9 to ENC12 transition.
a) Feature plots showing the expression profile change in BranchA (Etv1+) at E15.5. Dotted line demarcates the approximate border between ENC8/9 and ENC12 and coincide with onset of Pbx3 expression. b) Graph showing that the ratio of SOX10+ cells that incorporated EdU after a 90 min pulse injection is similar in Pbx3-/- mutants and wt controls (set to 1) at E15.5. n = 4 Pbx3-/- mutants vs wt controls animal pairs. c) Graph showing an unchanged ratio of HUC/D+ over SOX10+ cells in Pbx3-/- mutants compared with wt controls (set to 1) at E15.5 and E18.5. n = 4-5 animal pairs. d) Graph showing the ratio between the percentages of neurons (HUC/D) expressing different neurotransmitters/peptides in Pbx3-/- mutant and control (set to 1). Two-sided Student’s Paired t-test was used for statistical analysis. n= 5-6 animal pairs. *p <0.05; bar graphs show mean SD. CALB: p=0,015; NOS1: p=0,013; GAL: p=0,038; VIP: p=0,02. The absolute percentages were: NOS1: Wt: 34,75 ± 5,26%; Mutant: 44,56 ± 7,69%; GAL: Wt: 13,40 ± 2,10%; Mutant: 17,85 ± 1,32%; VIP: Wt: 12,28 ± 4,20%; Mutant: 14,48 ± 4,43%; CALB: Wt: 5,95 ± 1,16%; Mutant: 3,4 ± 1,65%. e) Representative pictures of the small intestine at E18.5 in wt and Pbx3-/- embryos showing increased ratios of neurons expressing NOS1, GAL and VIP and decreased ratio of neurons expressing CALB. f) Schematic drawing indicating the increased number of presumed ENC8/9 at the expense of ENC12 neurons in the ENS of Pbx3-/- mutant mice compared to control. (d). Color channels were individually adjusted in (e); wt: wildtype; EdU: 5-ethynyl-2 deoxyuridine; HUC/D: Elav-Like Protein 3/4; GAL: Galanin: NOS1: Nitric Oxide Synthetase 1; CALB, Calb1: Calbindin; VIP: Vasoactive Intestinal Peptide; ENC: Enteric Neuron Class.

