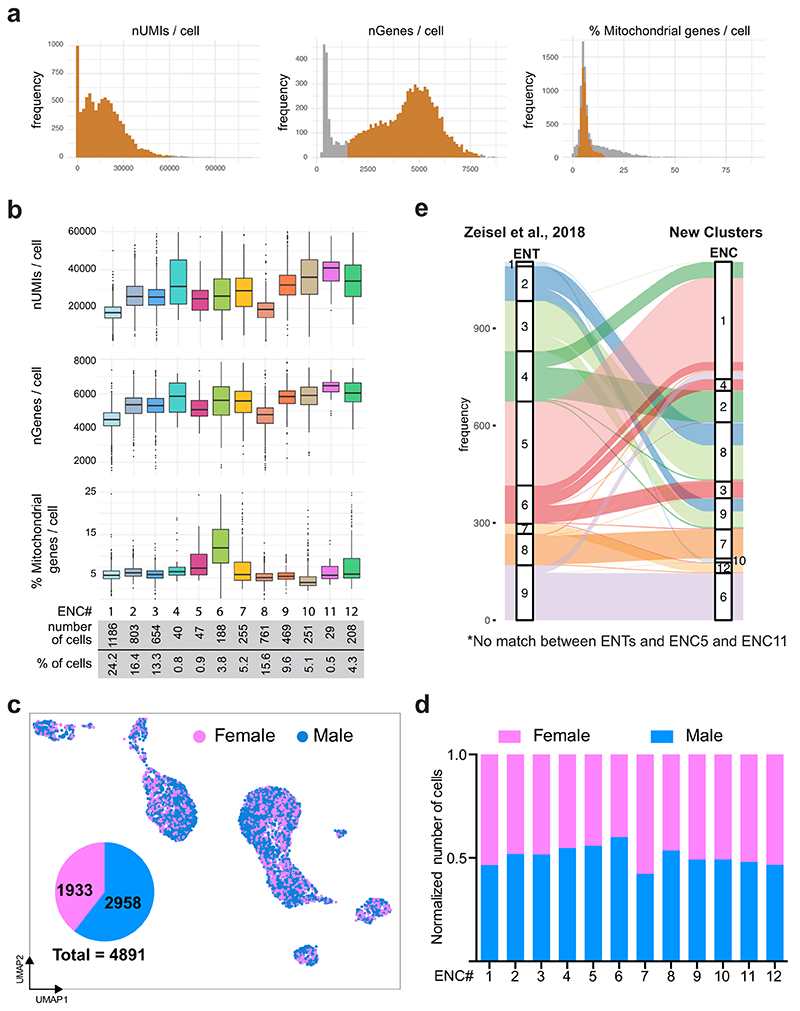
Extended Data Fig. 1. Supportive Data related to Figure 1d-g.
a) Frequency distribution of the number of UMIs, detected genes and percent of mitochondrial genes per cell. Orange bars indicate proportion of cells passing the thresholding for each parameter. b) Box plots showing number of UMIs, detected genes and percent of mitochondrial genes per cell for each of the ENCs. Box-and-whisker plots indicate max-min (whiskers), 25-75 percentile (boxes) with median as a centre line. Points indicate outliers. c) UMAP depicting inferred female (Xist) and male (Eif2s3y, Ddx3y, Kdm5) cells. Pie-chart showing proportions of male and female cells (2:3 ratio). d) Bar-graph showing fraction of male and female cells in each ENC after normalized by total number of cells from each sex and scaled to 1. e) Label transfer relationship between previously proposed enteric neuron types (ENT)1-9 in Zeisel et al., 201818 and ENC1-12 presented in this study. Notably, ENC5 (Sst) and ENC11 (Npy/Th/Dbh) represent new clusters. ENT-clusters representing plausible excitatory (ENT4-6) and inhibitory (ENT2,3) motor neurons were not retained, but distributed into ENC1-4 and ENC8-9, respectively. UMI: Unique Molecular Identifier; ENT: Enteric Neuron Type; ENC: Enteric Neuron Class; UMAP: Uniform Manifold Approximation and Projection.

