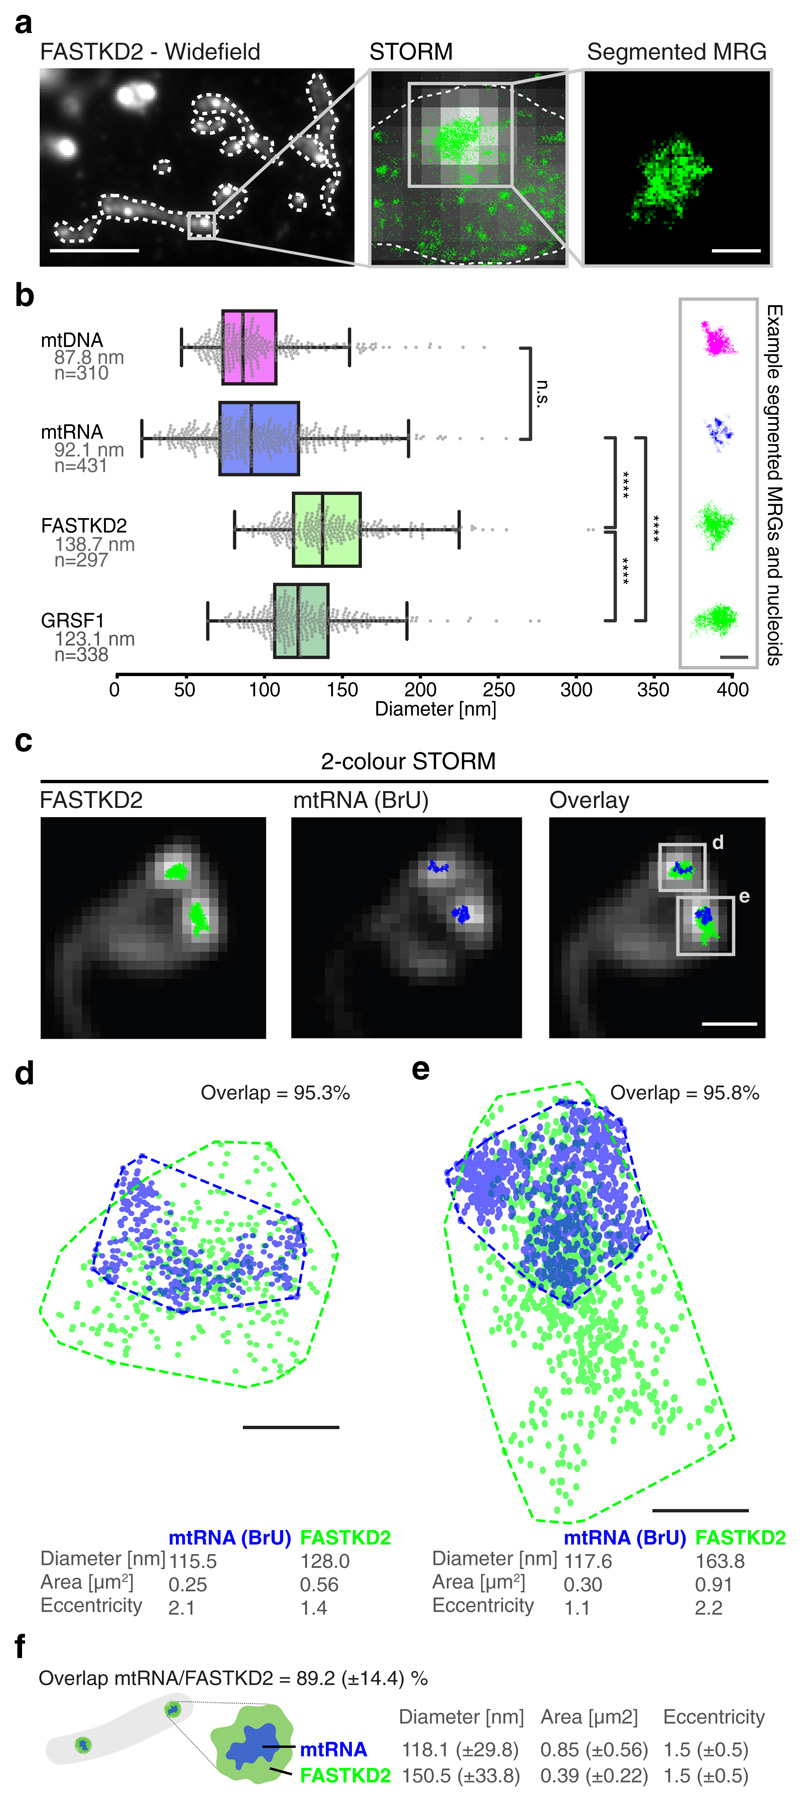
Fig. 1. The nanoscopic architecture of MRGs consists of compacted RNA surrounded by RNA binding proteins.
a, Widefield immunofluorescence of FASTKD2 (right) shows punctate, diffraction limited MRGs within mitochondria (white dashed lines). Scale bar: 10 μm. Zoom (centre) of a representative MRG, overlay of STORM (green) and widefield images (greyscale). The MRG is segmented (right) by its high density of STORM localisations using DBSCAN 25. Images are representative of the dataset are shown in (b). Scale bar: 200 nm. b, MRG (mtRNA, FASTKD2, or GRSF1) and nucleoid (mtDNA) diameters determined by mean full width at half maximum (FWHM) from htSTORM images. Number (n) of clusters quantified for each condition is represented in the figure and is pooled from 24, 13, 7, and 14 FOVs, and 4, 4, 3, and 2 samples for BrU, GRSF1, FASTKD2, and mtDNA respectively. Median diameter and number of analysed clusters are noted. Box plots denote first and third quartiles as well as the median, whiskers comprise rest of distributions except outliers. Two-sided Mann-Whitney-U test was used and **** denotes p-values < 0.0001; n.s. is non-significant (pBrU-mtDNA = 1, pBrU-FASTKD2 = 1.0x10-48, pBrU-GRSF1 = 4.5x10⁻³⁰, pGRSF1-FASTKD2 = 3.1x10⁻¹¹). Representative images are shown (right). Scale bar: 200 nm. c, Example of two-colour htSTORM of MRGs (anti-FASTKD2, green) and mtRNA (anti-BrdU, blue) overlaid on widefield images (grey). Scale bar: 500 nm. Images are representative of the dataset shown in (f). d, e Scatter plot of localisations from clusters in c. Areas were estimated using a convex hull (dashed line) and used to find the percent overlap between channels. Diameter and eccentricity were also quantified (Supplementary Information). Scale bar: 100 nm. f, Schema of MRG organisation and median ±SD values for all analysed two-colour htSTORM clusters (n = 26 MRGs examined over 8 independent experiments). Statistical source data are provided in Source data fig. 1.

