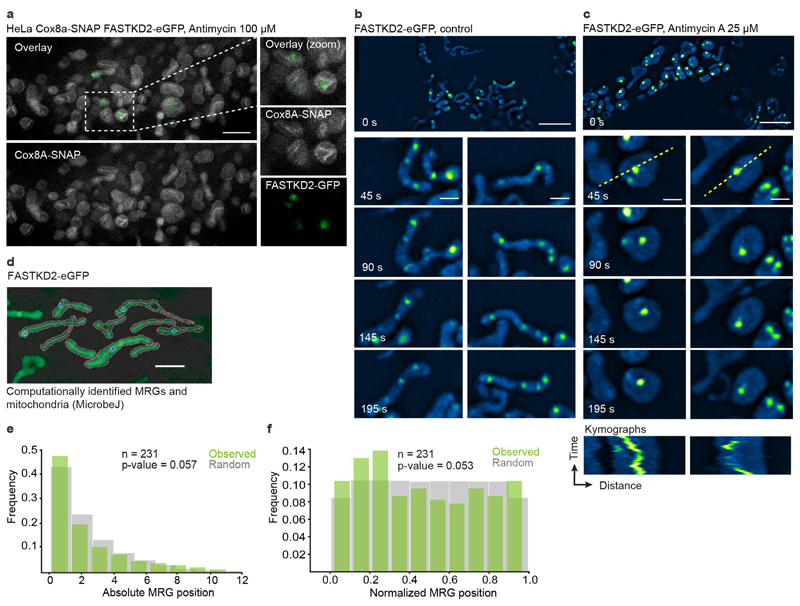
Extended Data Fig. 6. Membrane association and distribution of MRGs within mitochondria.
a, STED microscopy of HeLa cells stably expressing Cox8a-SNAP (grey) and FASTKD2-eGFP (green), treated with 100 μM antimycin A for 1 hour, prior to labelling with SIR-SNAP dye and live cell imaging (The experiment has been performed twice with similar results). A zoomed field of view on the right (dashed box). Scale bar: 2 μm. b-c, FASTKD2-eGFP expressing COS-7 cells untreated (b) or treated with 25 μM antimycin A for 24 hours (c), imaged live using SIM microscopy. Zoomed time lapse series are shown for two mitochondria (dashed boxes) (The experiment has been performed twice with similar results). Kymographs below (plotted lines are represented on the analysed mitochondria as yellow dashed lines). Scale-bar: 2 μm. d, Example FOV of semi-automated mitochondria segmentation and MRG-association with their parent organelle with the ImageJ plugin, MicrobeJ. (The experiment has been performed three times with similar results). e, and f, Histograms of absolute or relative position of MRGs (n = 231 MRGs examined over 3 independent experiments) within their host mitochondria (green) and simulated, randomly positioned granules (grey). The observed distribution of MRG positions is not significantly different from the simulated random distribution (Kolmogorov-Smirnov test: pabs = 0.057, pnorm = 0.053). Statistical source data are provided in Source data Extended data fig. 6.

