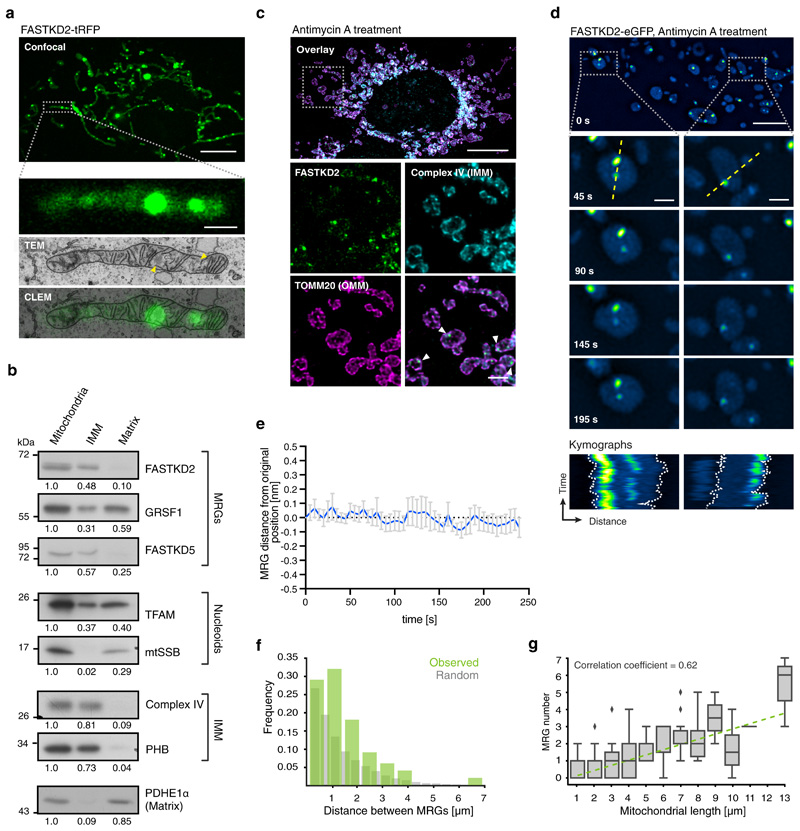
Fig. 3. MRGs are associated with inner mitochondrial membranes, and are randomly spaced along the mitochondrial network.
a, Correlated fluorescence (axially-projected confocal image, green) and transmission electron micrograph (TEM, greyscale), in a FASTKD2-tRFP expressing COS-7 cell. Electron densities corresponding to MRGs are visible (arrowheads)(n= 7 MRGs from 3 mitochondria). Scale bars: 10 μm (top), 1 μm (bottom). b, Western blot of fractionated mitochondria, probed with antibodies against MRG (FASTKD2, GRSF1, FASTKD5) and nucleoid (TFAM, mtSSB) components. IMM-integrated proteins (complex IV, PHB) and soluble matrix protein PDHE1α served as controls. Blots were processed simultaneously and compared quantitatively from the same gel. The experiment was performed twice with similar results. c, FASTKD2-eGFP expressing HeLa cells treated with 100 μM antimycin A for 1 hour, then fixed. IMM (anti-complex IV, cyan) and OMM (anti-TOMM20, magenta), reveal swollen mitochondria with few inner membranes. MRGs appear proximal to the IMM (arrowheads). The experiment was performed twice with similar results). Scale bars: 10 μm (top), 2 μm (bottom). d, FASTKD2-eGFP expressing COS-7 cells treated with 100 μM antimycin A for 1 hour, imaged live. Time-lapse series are shown for two exemplary mitochondria (dashed boxes). Kymographs (from yellow dashed line) highlight the co-mobility of individual granules. Scale bars: 10 μm (top), 1 μm (bottom). The experiment was performed twice with similar results e, MRG movement over time, measured as distance between MRG and closest membrane, for swollen mitochondria as exemplified in (d) (n = 20 MRGs examined from 3 cells). Data are represented as mean (blue line) ± SD (error bars). f, Histogram of the distance between neighbouring pairs of MRGs for unbranched mitochondria (n = 100 mitochondria over 3 independent experiments, green) and simulated randomly distributed granules (grey). g, Correlation between MRG number and length of unbranched mitochondria (n = 206 mitochondria over 3 independent experiments). Each box-plot indicates median, 1st and 3rd quartiles and diamonds show outliers for each bin (e.g.: bin_1 = 0–1 μm, etc.). Linear regression (green dashed line), was computed on non-binned data. Unprocessed blots and statistical source data are provided in Source data fig. 3.

