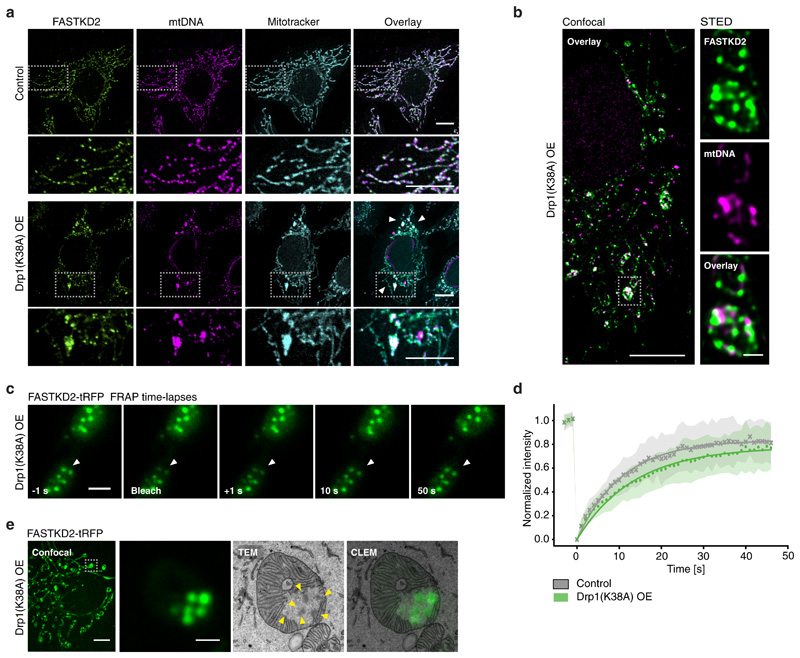
Fig. 4. Impaired mitochondrial fission leads to aberrant MRG positioning.
a, HeLa cells imaged by confocal microscopy in control settings (top) or after 48 hours of Drp1K38A overexpression (OE, bottom) stained for MRGs (anti-FASTKD2, green), nucleoids (anti-DNA, magenta), and mitochondria (Mitotracker Deep Red, cyan). Zoomed regions (grey (top) boxes, below). The experiment was performed three times with similar results. Scale bars: 10 μm (top), 1 μm (bottom). b, Confocal (left) and STED (right) images of mito-bulbs containing MRGs (anti-FASTKD2, green) and nucleoids (anti-mtDNA, magenta) in fixed Drp1K38A overexpressing COS-7 cells. The experiment was performed twice with similar results. Scale bars: 10 μm (left), 2 μm (right, zoom). c, Example of FRAP time lapse images from datasets represented in (d) of mito-bulb-associated MRGs (arrowheads), in FASTKD2-tRFP (green) stably expressing COS-7 cells transiently transfected with Drp1K38A for 24 hours. Scale bar: 2 μm. d, Comparison of FASTKD2-tRFP FRAP between control (n = 31 MRGs examined over 4 independent experiments) and Drp1K38A (n = 40 MRGs examined over 3 independent experiments) over-expressing cells. Symbols represent mean data points, lines are single exponential fits, and shaded areas standard deviations for each time point. e, Confocal fluorescence and TEM (CLEM) of MRGs (stable expression, FASTKD2-tRFP, green) in COS-7 cells, fixed 24 hours after Drp1K38A transfection. Zoom of a single mitochondrion shows several MRGs (arrowheads), resembling a bunch of grapes (10 MRGs were analysed from 3 mitochondria). Scale bars: 10 μm (left), 1 μm (right). Grey dashed boxes indicate magnified regions. Statistical source data are provided in Source data fig. 4.

