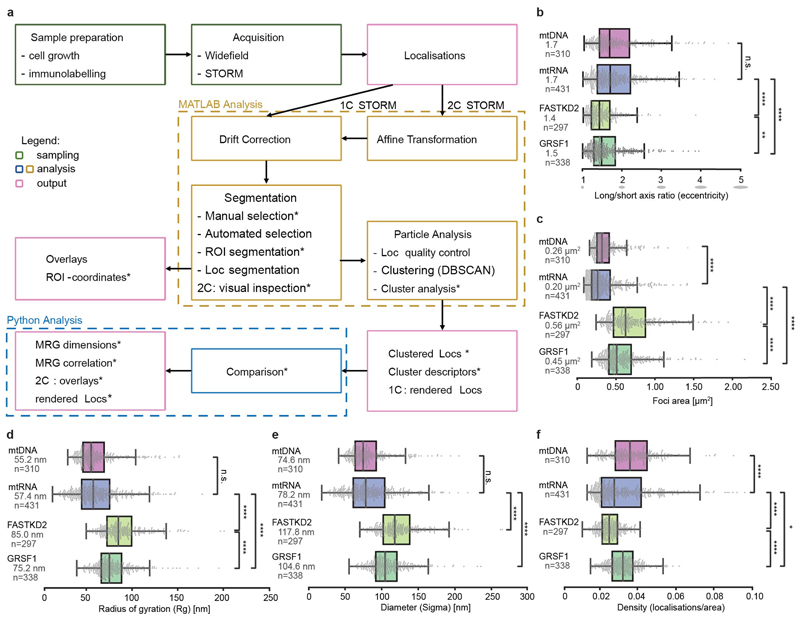
Extended Data Fig. 1. Workflow and quantification of nanoscopic architecture of MRGs.
a, Workflow used for this study. Previously unpublished parts of the analysis are highlighted by asterisks, while other parts were previously published 17, 37.
b - f Additional quantification of MRG and nucleoid (mtDNA) architecture from htSTORM data. Markers (mtRNA, FASTKD2 and GRSF1), number of granules n and median values are indicated for each condition; n.s. denotes p-values > 0.05, * denotes p-values = 0.05, ** denote p-values = 0.01, *** denote p-values = 0.001,**** denote p-values = 0.0001 of two-sided Mann-Whitney-U test. Individual data points are plotted grey, box plots denote first and third quartiles, and the median, whiskers comprise rest of distributions except outliers. Multiple acquisitions, samples and imaging days were pooled. b, Median eccentricity of both MRG-proteins differ slightly (p = 5.1e-3), with largely overlapping boxes and can be approximated by spheres. Nucleoids and nascent RNA components of MRGs are more elongated (pBrU-FASTKD2 = 1.4e-15, pBrU-GRSF1 = 1.7e-6). c, Comparison of areas described by convex hull. MRG-protein foci are significantly larger than nascent-RNA foci (pBrU-FASTKD2 = 2.7x10-61, pBrU-GRSF1 = 6.5x10-49), yet less different from one another (pGRSF1-FASTKD2 = 6.9x10⁻⁷). The distribution of mtRNA- and mtDNA-foci areas strongly overlap, though their medians are significantly different with pmtRNA-mtDNA = 1.2x10⁻⁶. Three outliers for FASTKD2 (> 2.5 μm2) were removed for better visualisation, but included in all quantitative analysis. d, and e, Show comparison of alternative standard point-cloud descriptors Radius of gyration (Rg), and Sigma as the average of the eigenvalues in two dimensions, and multiplied by two to yield a diameter. f, Density of localisations was also compared, and both GRSF1 and FASTKD2-foci follow a narrow normal distribution, while mtDNA & BrU show a larger variance of density. Number (n) of clusters quantified for each condition is represented in the figure and is pooled from 24, 13, 7, and 14 FOVs, and 4, 4, 3, and 2 samples for BrU, GRSF1, FASTKD2, and mtDNA respectively. Statistical source data are provided in Source data Extended data fig. 1.

