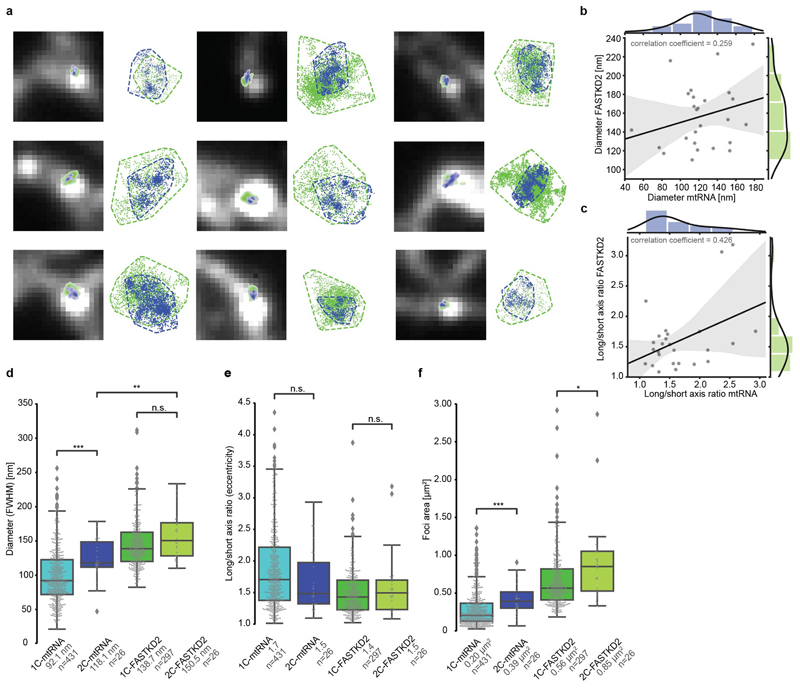
Extended Data Fig. 2. Comparison and correlation of two-colour htSTORM data.
a, Nine additional examples of two-colour htSTORM of MRGs. Scatter plots of localisations (right) are shown next to corresponding clusters of FASTKD2 (green) and mtRNA (BrU, blue) overlaid on widefield images (left). Convex hull areas are represented with dashed lines. b, and c, Scatter plots of all FASTKD2-mtRNA (BrU) pairs with regression-fit (black) and standard deviation (grey). Histograms of the distribution for FASTKD2 (y-axis, right, green), and mtRNA (x-axis, top, blue), including a kernel density estimate are shown. No correlation of Diameter (FWHM) (R = 0.26) or eccentricity (length/width, R = 0.43) was found between FASTKD2 and BrU foci from individual granules (n=26 MRGs over 4 independent experiments) d-f, Comparison of foci characteristics for one- versus two-colour htSTORM by Two-sided Mann-Whitney-U test from two-colour to one-colour data. Number of granules n (pooled from 20 FOVs, and 8 samples) and median values are indicated for each condition; n.s. denotes p-values > 0.05, * denotes p-values = 0.05, ** denote p-values = 0.01, *** denote p-values = 0.001,**** denote p-values = 0.0001. d, FWHM is not significant for FASTKD2 (p = 0.22) but two-colour BrU foci were significantly larger (p = 8.8e-4), and two-colour FASTKD2 were also larger than two-colour-mtRNA (p = 0.0014) e, Eccentricity is not significantly different (pmtRNA = 0.36, pFASTKD2 = 1.0) f, Size determined by convex hull, differed between one-colour and two-colour BrU (p = 2.4e-4) as well as FASTKD2 (p = 0.017). This may in parts be due to the heavy weight of two outliers as visible in the plot. Statistical source data are provided in Source data Extended data fig. 2.

