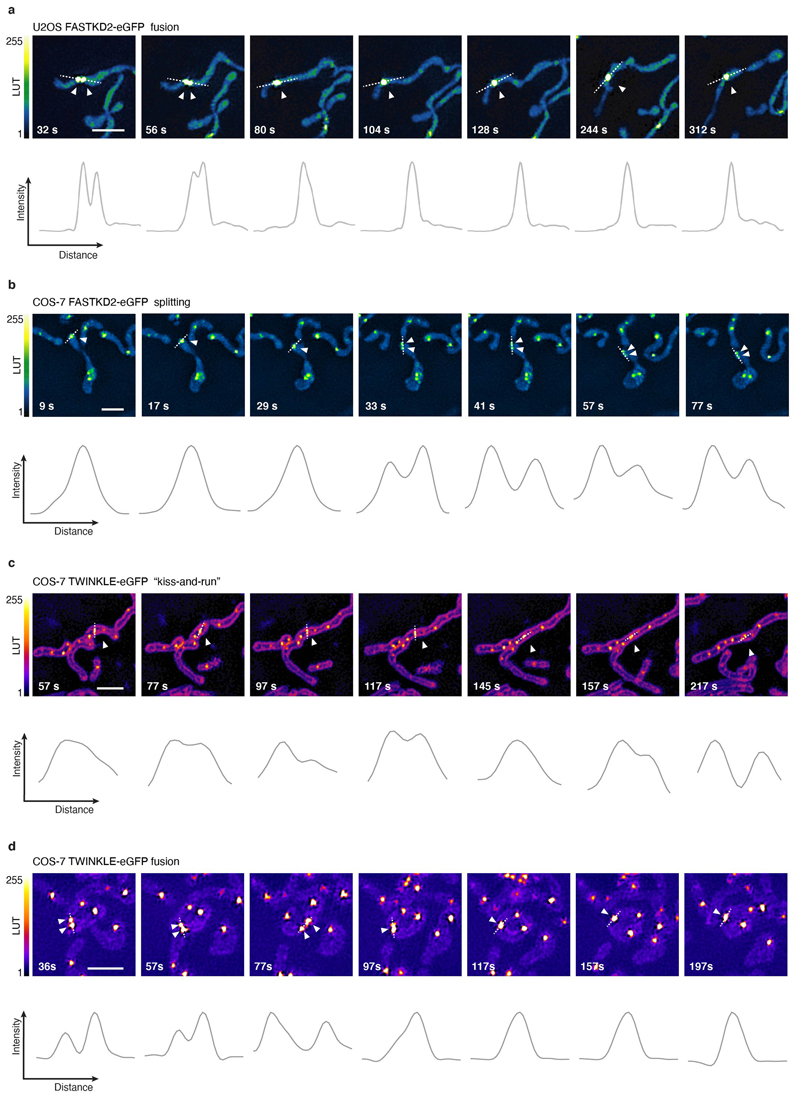
Extended Data Fig. 4. MRG and nucleoid dynamics in live cells.
a, Representative time lapse images of an MRG fusion event in a live U2OS cell, monitored by SIM. MRGs are visualized by stable expression of FASTKD2-eGFP (n= 7 cells). b, Representative time lapse images of an MRG splitting event in a live COS-7 cell, monitored by SIM. MRGs are visualized by stable expression of FASTKD2-eGFP (n= 6 cells). c, d, Representative time lapse images of nucleoid “kiss-and-run” (n=1 cell) and splitting events (n=2 cells), respectively, in COS-7 cells, monitored by SIM. Nucleoids are visualized by transient expression of TWINKLE-eGFP and mitochondrial outlines are highlighted by TOMM20-eGFP expression. a-d, Cells were imaged at 1/5 Hz. White arrowheads indicate the dynamic events. Dashed lines indicate the segments used to measure the intensity (grey values) represented in the plots below. Scale bars: 2 μm. Statistical source data are provided in Source data Extended data fig. 4.

