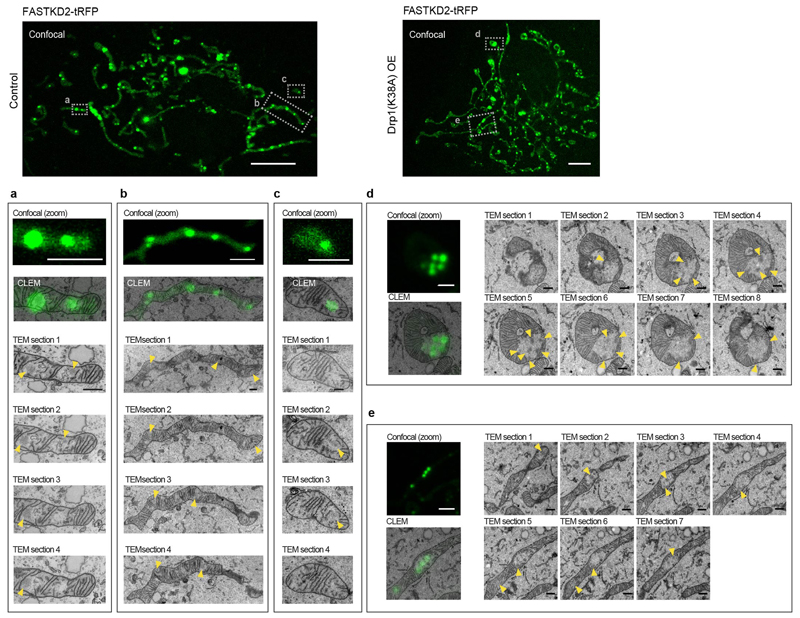
Extended Data Fig. 5. CLEM of FASTKD2-tRFP and MRG electron densities.
Correlative confocal fluorescence micrograph of FASTKD2-tRFP and transmission electron micrograph (TEM) in COS-7 control (a - c)(7 MRGs were examined from 3 mitochondria of a single cell) and Drp1K38A-CFP positive (d, e)(10 MRGs were examined from 2 mitochondria of a single cell) cells. TEM-highlights correspond to the data presented in Fig. 3a and Fig. 4e respectively, and show additional examples. Contiguous 50 nm TEM microtome sections show electron densities corresponding to the MRGs visualized by fluorescence microscopy (yellow arrowheads). Scale bars: Confocal: 10 μm; Confocal zoom: 2 μm; CLEM and TEM sections: 500 nm.

