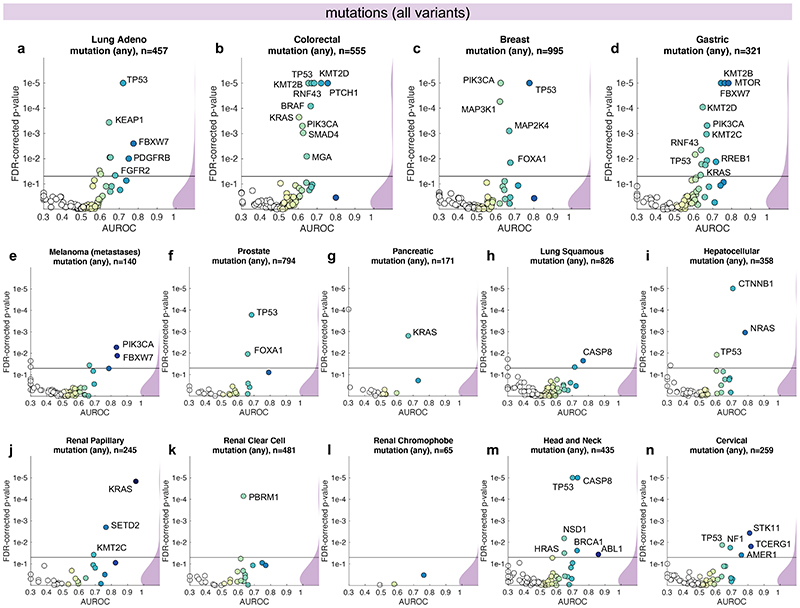
Fig. 2. Inference of genetic mutations from histological images.
A deep learning system was trained to predict mutational status (mutated or wild-type) of relevant genes in 14 cancer type and was evaluated by cross-validation. All mutations, including variants of unknown significance, were included in the ‘mutated’ class. For each gene, patient-level test set performance is shown as area under the receiver operating curve (AUROC) with two-sided t-test p-value for prediction scores corrected for multiple testing (false detection rate, FDR). The significance level of 0.05 is marked with a line and the distribution of p-values in each panel is shown as a density plot. P values smaller than 10−5 are set to 10−5. On the right-hand side of each panel, a kernel density estimate shows the distribution of all plotted data points. “n” denotes the number of patients with available genetic information and matched histology images in each tumor type. (a-d) In lung adenocarcinoma, colorectal cancer, breast cancer and gastric cancer, a number of relevant genes were significantly predictable from histology alone, including key oncogenic drivers such as TP53, BRAF and MTOR. (e-n) In all other tested tumor types, mutational status was predictable for some genes, with notable examples including KRAS in pancreatic cancer, CTNNB1 in hepatocellular carcinoma and TP53 and CASP8 in head and neck cancer.

