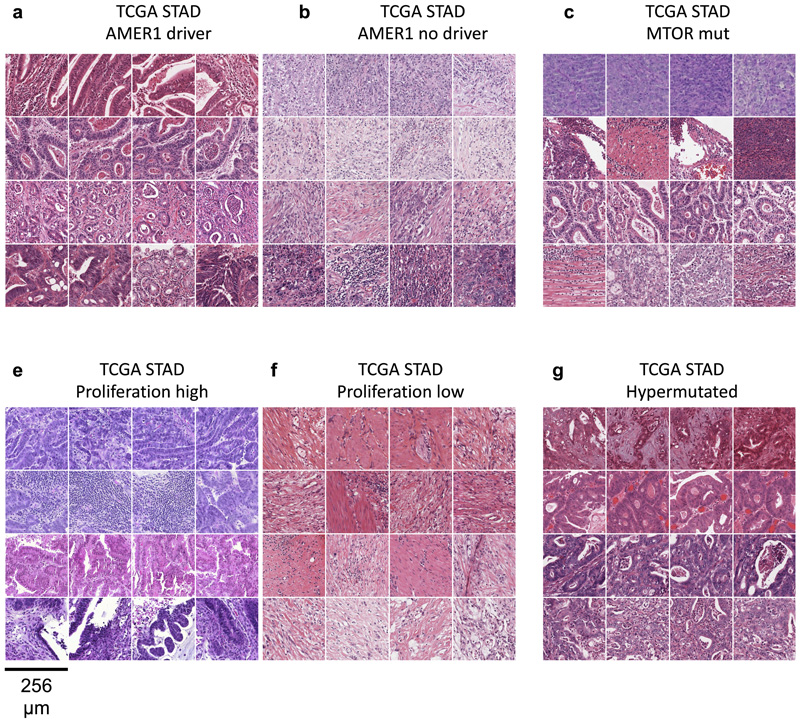
Fig. 6. Highest scoring image tiles for molecular features in gastric cancer.
(a-b) Highest scoring tiles in highest scoring patients corresponding to AMER1 mutational status in the TCGA-STAD data set. (c-d) Tiles corresponding to MTOR mutational status. (e-f) Tiles corresponding to high or low values of a proliferation signature. (a-b) Tiles corresponding to hypermutated samples.

