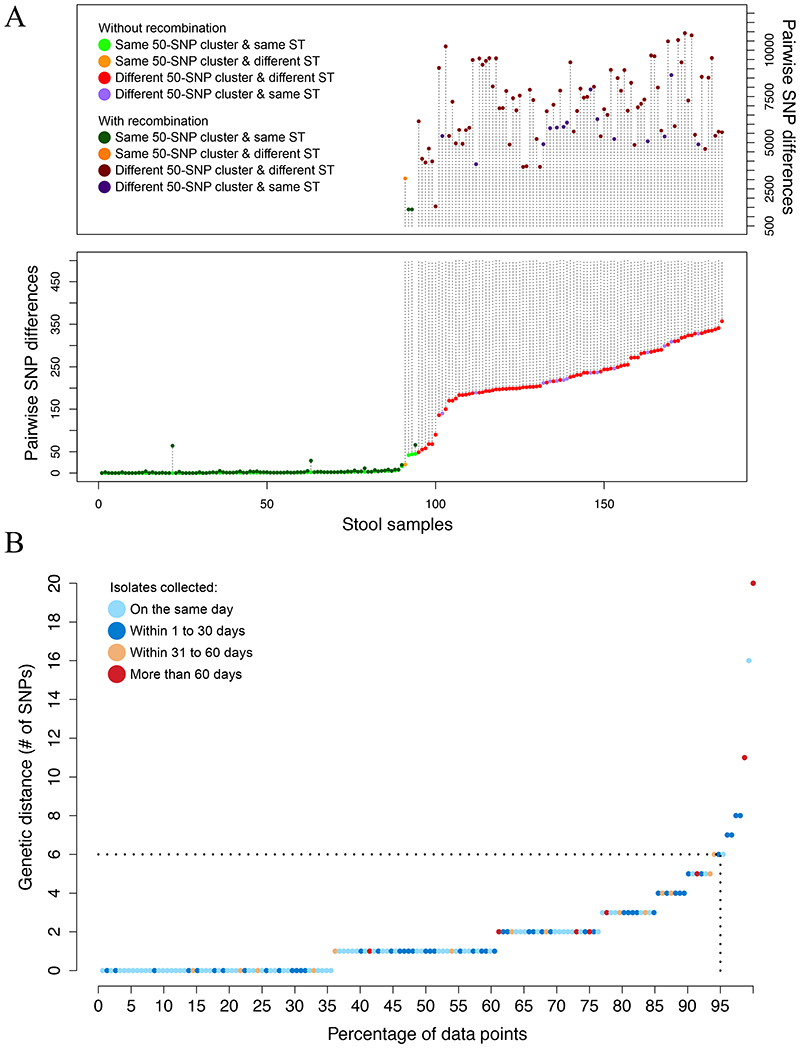
Figure 2. E. faecium within host diversity.
(A) Pairwise SNP differences between isolates of the same stool before and after removing recombination for a total of 185 stool samples. In samples with all isolates belonging to the same 50-SNP cluster, the maximum distance is plotted. In samples with multiple 50-SNP clusters, the minimum SNP distance between isolates from different clusters is plotted. Colors are used to indicate whether isolates belong to the same cluster and ST. The length of the vertical dotted lines denote the number of SNPs attributable to recombination. (B) Maximum pairwise SNP distance among isolates of the same subtype and in the same patient (n=152). The color of the dot denotes the time span between isolates.

