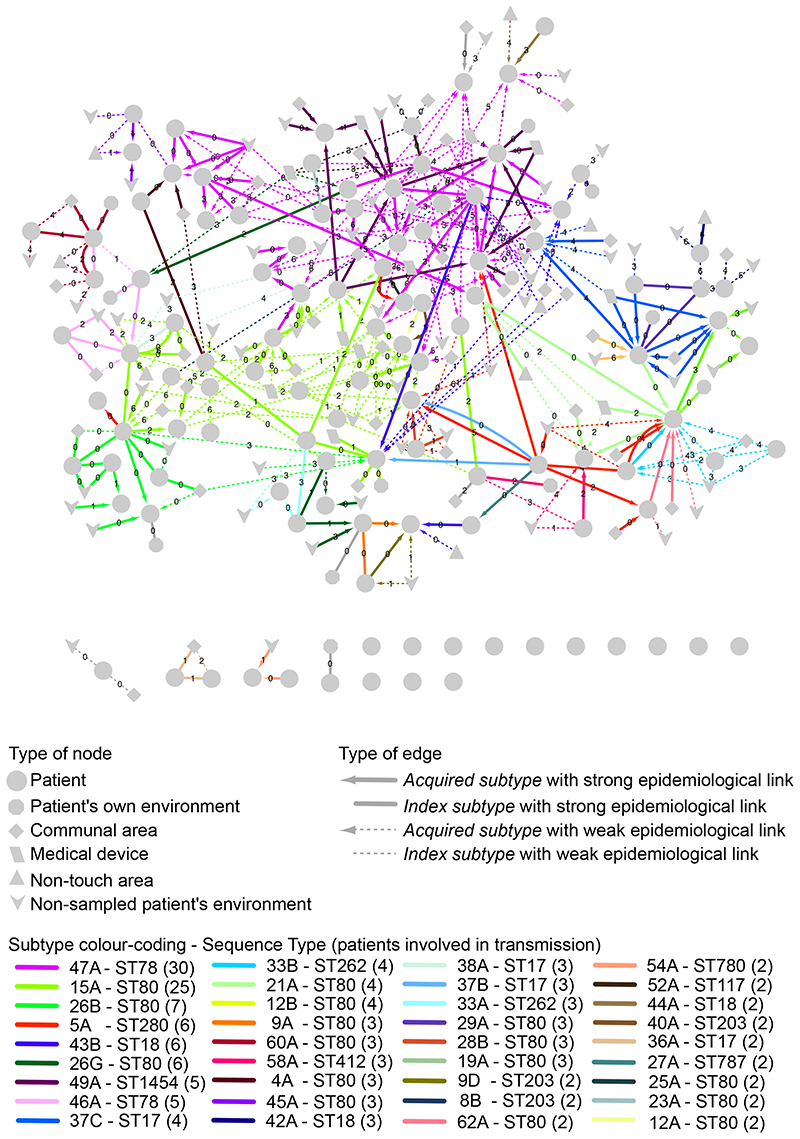
Figure 4. E. faecium transmission network.
Transmission of clade A1 E. faecium subtypes between patients (n=111) and their environment represented as a network. Only those environmental locations from which E. faecium was cultured that was genetically related (isolate within 0 to 6 SNPs) to at least one patient isolate are shown. For each patient node, lines show the shortest genetic link (within 0 to 6 SNPs) to a previously sampled patient or environmental location (putative transmission). Numbers on network edges show SNP distances. Edge colors show the subtype being transmitted. Acquired subtype refers to subtypes not present in previously collected stool samples, whereas subtypes present in the first available stool are termed index subtypes.

