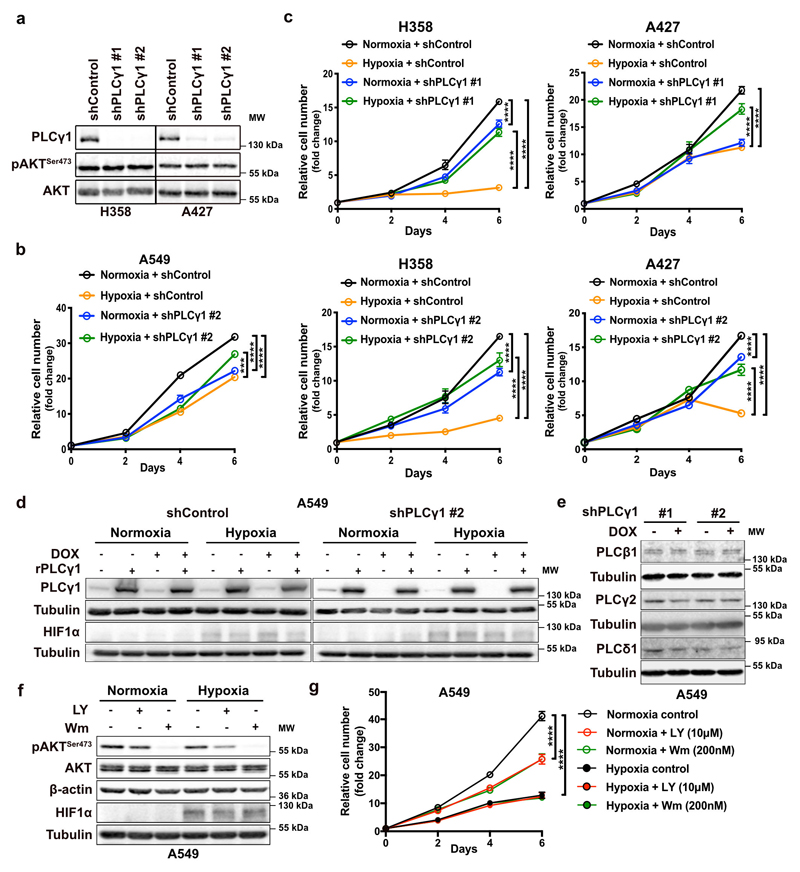
Extended Data Fig. 2. PLCγ1 suppression promotes cancer cell proliferation during hypoxia.
(a) Immunoblot analysis of the indicated targets in H358 and A427 cells transduced with either an empty vector control (Tet-pLKO-puro, shControl) or 2 doxycycline-inducible shRNAs against PLCγ1. Cells were incubated in the presence of doxycycline for 72h in normoxia before performing the immunoblot analysis.
(b, c) Relative cell number of A549, H358 and A427 cells transduced with either an empty vector control (Tet-pLKO-puro, shControl), or a doxycycline-inducible shRNA against PLCγ1 (as indicated). After this, cells were plated and incubated for the indicated time in normoxia or hypoxia; n = 3.
(d) Immunoblot analysis of the indicated targets in A549 cells transduced as in (b). Cells were then incubated in the presence of doxycycline and transfected with either pcDNA3.1 empty vector or pcDNA3.1-rPLCγ1 (shRNA-resistant PLCγ1) and incubated for 72h in normoxia or hypoxia.
(e) Immunoblot analysis of the indicated targets in A549 cells transduced as in (a).
(f, g) Immunoblot analysis of the indicated targets (f) and cell proliferation assay (g) of A549 cells treated as indicated in normoxia or hypoxia; n = 3.
All graphical data are presented as mean ± SD. Statistical analyses were done using one-way ANOVA; n, number of biologically independent samples. **** p < 0.0001. Statistical source data and unprocessed immunoblots are provided in Source Data Extended Data Fig. 2.

