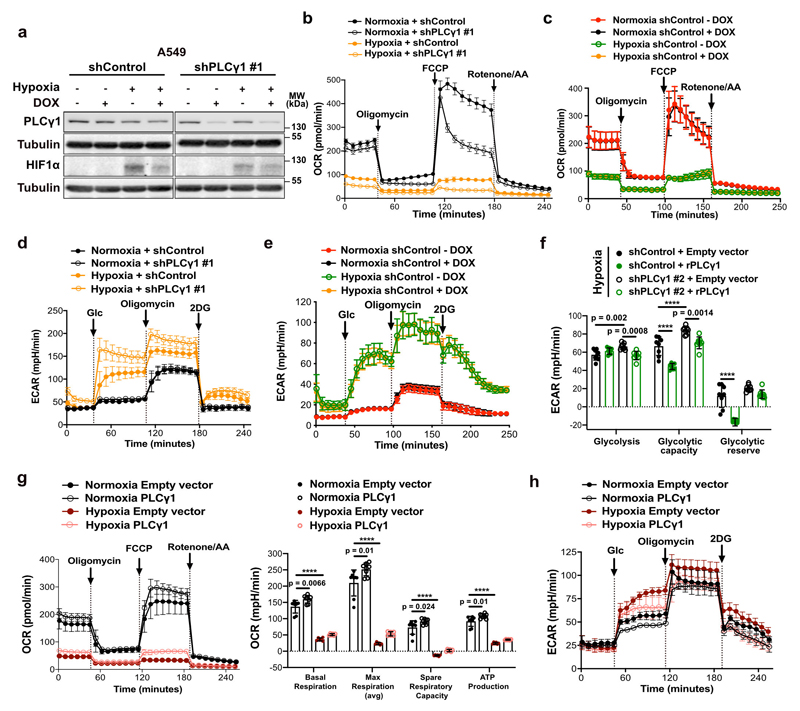
Extended Data Fig. 4. PLCγ1 suppression decreases mitochondrial respiration and enhances cancer cell glycolytic capacity in human NSCLC cells.
(a) Immunoblot analysis of the indicated targets in A549 cells transduced with either an empty vector control (Tet-pLKO-puro, shControl) or a doxycycline-inducible shRNA against PLCγ1, incubated without/with doxycycline for 48h and further incubated for 48h in normoxia or hypoxia (3% O2).
(b-e) Graphs showing oxygen consumption rate (OCR, b and c) and extracellular acidification rate (ECAR, d and e) of A549 cells transduced and treated as in (a); n replicates/group: (b) = 8, (c) = 7 normoxia/8 hypoxia, (d) = 9 normoxia/ 8 hypoxia, (e) = 8. Panels (c and e) are treated without/with doxycycline and serve as a control for the doxycycline effect on cells.
(f) Bar graph showing ECAR parameters in A549 cells transduced as in (a). Cells were transfected with either pcDNA3.1 empty vector or pcDNA3.1-rPLCγ1 (shRNA-resistant PLCγ1) to rescue the shPLCγ1 #2 and incubated for 48h in normoxia or hypoxia; n = 8.
(g-h) Oxygen consumption rate (g) and extracellular acidification rate (h) parameters of A549 cells transfected with either pcDNA3.1 empty vector or pcDNA3.1-PLCγ1 and incubated for 48h in normoxia or hypoxia; (g) n = 8 for normoxia and 6 for hypoxia groups, (h) n = 7.
OCR was determined during sequential treatments with oligomycin, FCCP and rotenone/antimycin (AA). ECAR was determined during sequential treatments with glucose (Glc), oligomycin and 2 deoxyglucose (2DG).
Graphical data are mean ± SD. Statistical analyses were done using one-way ANOVA; n, number of biologically independent samples. **** p < 0.0001. Statistical source data and unprocessed immunoblots are provided in Source Data Extended Data Fig. 4.

