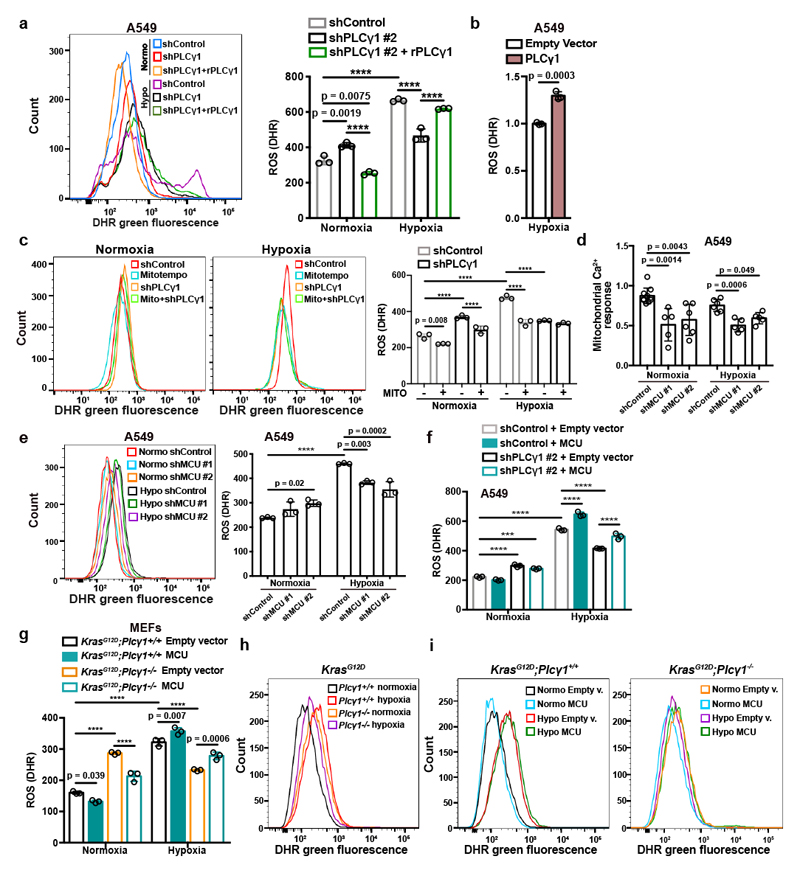
Figure 4. PLCγ1 suppression depletes mitochondrial ROS through impairment of Ca2+ entry into mitochondria.
(a) Representative flow cytometry histogram (left) and quantification of DHR (ROS marker, green) (right) of A549 cells transduced with either an empty vector (Tet-pLKO-puro, shControl) or a doxycycline-inducible shRNA against PLCγ1. Cells were then transfected with either pcDNA3.1 empty vector or pcDNA3.1-rPLCγ1: shPLCγ1 #2-resistant PLCγ1 and incubated in normoxia or hypoxia for 48h. DHR: Dihydrorhodamine; n = 3.
(b) Flow cytometry quantification of DHR (green) in A549 cells (relative to control) transfected with either pcDNA3.1 empty vector or pcDNA3.1-PLCγ1 and moved to hypoxia for 48h. DHR: Dihydrorhodamine; n = 3.
(c) Representative flow cytometry histograms (left) and quantification of DHR (green, right) of A549 cells transduced and treated as in (a). 18h before staining with DHR for analysis cells were treated with 10μM MitoTEMPO. DHR: Dihydrorhodamine. Mito: MitoTEMPO; n = 3.
(d) Mitochondrial Ca2+ response of A549 cells transduced with an empty vector (Tet-pLKO-puro, shControl) or 2 doxycycline-inducible shRNAs against MCU. Cells were then treated with doxycycline for 24h, transfected with appropriate targeted-aequorin probe and histamine-induced Ca2+ measurements were performed after 48h of incubation in normoxia or hypoxia; n/group = 9, 5, 6, 6, 5, 5.
(e) Representative flow cytometry histogram (left) and quantification of DHR (green, right) of A549 cells treated as in (d). DHR: Dihydrorhodamine. n = 3.
(f) Flow cytometry quantification of DHR (green) of A549 cells transduced as in (a). Cells were then transfected with either pcDNA3.1 empty vector or pcDNA3.1-MCU-flag plasmid and incubated in normoxia or hypoxia for 48h. DHR: Dihydrorhodamine; n = 3.
(g-i) Flow cytometry quantification (g) and representative histograms (h and i) of DHR (green) in MEFs of the indicated genotype. MEFs were transfected with either pcDNA3.1 empty vector or pcDNA3.1-MCU-flag plasmid and incubated in normoxia or hypoxia for 48h. DHR: Dihydrorhodamine; n = 3.
Graphical data are mean ± SD. Statistical analyses were done using two-tailed unpaired Student’s t test or one-way ANOVA; n, number of biologically independent samples. **** p < 0.0001. Statistical source data are provided in Source Data Fig. 4.

