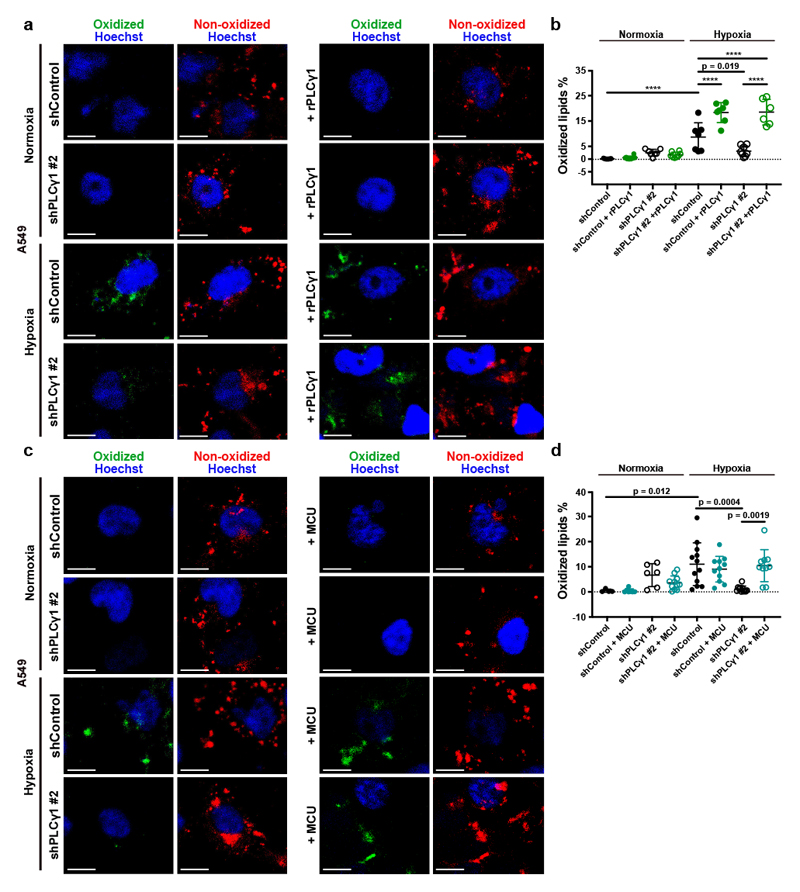
Figure 6. PLCγ1 suppression reduces hypoxia-induced lipid peroxidation.
(a) Representative confocal microscopy images showing oxidized and non-oxidized lipids in A549 cells. A549 cells were transduced with either an empty vector control (Tet-pLKO-puro, shControl) or a doxycycline-inducible shRNA against PLCγ1 (shPLCγ1 #2). Cells were then incubated in the presence of doxycycline and transfected with either pcDNA3.1 empty vector or pcDNA3.1-rPLCγ1 (shRNA-resistant PLCγ1: rPLCγ1) to rescue the shPLCγ1 #2. Cells were then incubated for additional 48h in normoxia or hypoxia (1% O2), stained with BODIPY 581/591 C11 (green: oxidized lipids / red: non-oxidized lipids) and Hoechst (nuclei in blue) and analyzed by microscopy. Oxidation of the polyunsaturated butadienyl portion of BODIPY 581/591 C11 results in a shift of the fluorescence emission peak from ~590 nm (red) to ~510 nm (green). Scale bars: 20 μm.
(b) Quantification of lipid peroxidation expressed as percent of oxidized lipids from (a); n biologically independent replicates/group = 7, 8, 7, 8, 7, 7, 8 and 6.
(c) Representative confocal microscopy images showing oxidized and non-oxidized lipids in A549 cells previously transduced with either an empty vector control (Tet-pLKO-puro, shControl) or a doxycycline-inducible shRNA against PLCγ1 (shPLCγ1 #2). Cells were then treated with doxycycline for 24h and transfected with either pcDNA3.1 empty vector or pcDNA3.1-MCU-flag. After this, cells were incubated for additional 48h in normoxia or hypoxia (1% O2), stained with BODIPY 581/591 C11 (green: oxidized lipids / red: non-oxidized lipids) and Hoechst (nuclei in blue) and analyzed by microscopy. Scale bars: 20 μm.
(d) Quantification of lipid peroxidation, expressed as percent of oxidized lipids from (c); n biologically independent replicates/group = 4, 7, 6, 11, 12, 11, 11 and 10.
Graphical data are mean ± SD. Statistical analyses were done using one-way ANOVA. **** p < 0.0001. Statistical source data are provided in Source Data Fig. 6.

