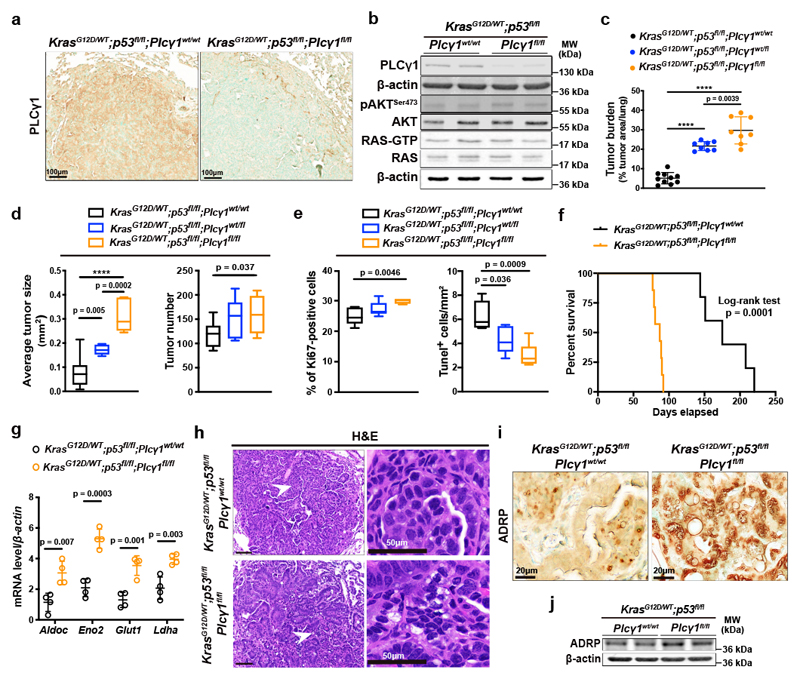
Figure 7. Plcγ1 deletion accelerates Kras-driven lung tumorigenesis and results in poor survival.
(a) Representative images of immunohistochemistry against PLCγ1 in mouse lung tissue of the indicated mice 10 weeks after Cre induction.
(b) Representative immunoblot analysis of the indicated targets and RAS activity assay (bottom) in dissected lung tumors of the indicated mice treated as in (a).
(c) Lung tumor burden quantification of mice with the indicated genotype 10 weeks after Cre induction; n mice/group: 10, 8, 8.
(d) Average lung tumor size and tumor number of mice with the indicated genotype 10 weeks after Cre induction. Tumor size n mice/group: 10, 7, 7 and tumor number n mice/group: 10, 8, 7. The box-plots span from the first to third quartile (depicting the median as a line in the middle), the whiskers extend to 1.5 x IQR (interquartile range).
(e) Quantification of Ki67 and number of Tunel-positive cells in mouse lung tumors from LSL-KrasG12D/WT;p53flox/flox;Plcγ1wt/wt (n = 5 mice), LSL-KrasG12D/WT;p53flox/flox;Plcγ1wt/flox (n = 8 mice for Ki67 and 5 mice for Tunel) and LSL-KrasG12D/WT;p53flox/flox;Plcγ1flox/flox (n = 5 mice for Ki67 and 6 mice for Tunel) mice, 10 weeks after Cre induction. The box-plots span from the first to third quartile (depicting the median as a line in the middle).
(f) Kaplan-Meier analysis showing the percent survival of LSL-KrasG12D/WT;p53flox/flox;Plcγ1wt/wt (n = 7 mice/group) and LSL-KrasG12D/WT;p53flox/flox;Plcγ1flox/flox (n = 8 mice/group) mice. Statistical analysis was done using log-rank (Mantel-cox) test.
(g) mRNA level of the indicated genes from dissected mouse lung tumors of the indicated mice 10 weeks after Cre induction; n = 4 mice/group.
(h) Hematoxylin & eosin (H&E) staining of mice with the indicated genotype 10 weeks after Cre induction. Scale bars left: 100 μm. The white arrows mark the magnified area on the right.
(i, j) Representative images of immunohistochemistry (i) and immunoblot for ADRP in mouse lung cancer tissue of the indicated genotype 10 weeks after Cre induction.
Graphical data are mean ± SD. Statistical analyses were done using two-tailed unpaired Student’s t test or one-way ANOVA. **** p < 0.0001. Statistical source data and unprocessed immunoblots are provided in Source Data Fig. 7.

