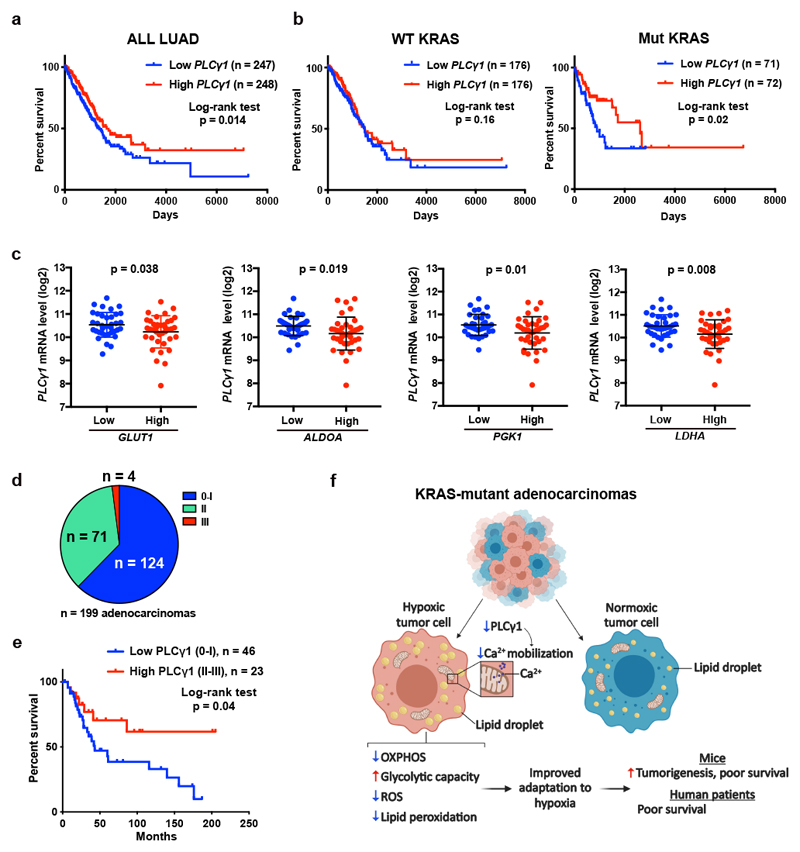
Figure 8. Low PLCγ1 levels in human lung adenocarcinomas correlate with poor patient survival.
(a, b) Kaplan-Meier analysis from The Cancer Genome Atlas (TCGA, subset LUAD) database containing 495 human lung adenocarcinomas showing the percent survival of PLCγ1-low versus PLCγ1-high lung adenocarcinomas, subset LUAD (a) and after separation of the LUAD cohort into wild type KRAS or mutant KRAS cohorts (b). The stratification in high/low expressing groups were performed by median separation. The number of patients and statistical significance is indicated. Statistical analyses were done using log-rank (Mantel-cox) test.
(c) Expression of PLCγ1 (log2) after quartile-based separation of the mutant KRAS patient cohort from (b) into GLUT1, ALDOA, PGK1 and LDHA low (n = 36) versus high (n = 37) expression corresponding to the first and the fourth quartile, respectively. The data are presented as mean ± SD. Statistical analyses were done using two-tailed unpaired Student’s t test.
(d) Pie chart showing the number of patients with high PLCγ1 protein levels (score III; n = 4), moderate (score II; n = 71) or negative to very low (score 0-I; n = 124) from a tumor tissue microarray (TMA) comprising 199 human lung adenocarcinomas. The TMA was processed for IHC against total PLCγ1 and the staining intensity was scored by a pathologist. The validation of the antibody is reported in Extended Data Fig. 10a.
(e) Kaplan-Meier analysis showing the percent survival of PLCγ1-low versus PLCγ1-high lung adenocarcinomas for the patients with known survival information that succumbed to lung cancer (n = 23 PLCγ1-high and n = 46 PLCγ1-low) from the TMA described in (d). For the rest of the patients either complete survival information was not available or they succumbed to other causes. The number of patients and statistical significance is indicated. Statistical analysis was done using log-rank (Mantel-cox) test.
(f) Working model for the improved adaptation of cancer cells to hypoxia by PLCγ1 suppression. In hypoxia, PLCγ1 is suppressed leading to decreased Ca2+ entry into the mitochondria, decreased OXPHOS, ROS and lipid peroxidation while increases glycolysis.
N, number of patients. Statistical source data are provided in Source Data Fig. 8.

