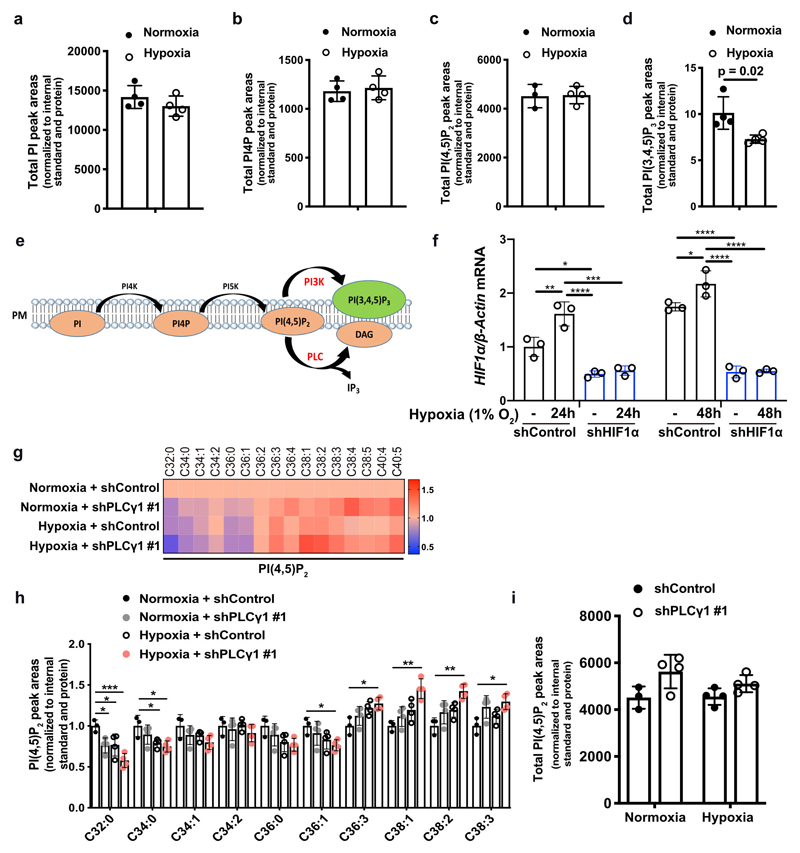
Extended Data Fig. 1. Hypoxia suppresses PLCγ1 and alters the fatty acid composition of phosphoinositides.
(a-d) Total PI (a), PI4P (b), PI(4,5)P2 (c) and PI(3,4,5)P3 (d) peak areas of A549 cells in normoxia and upon shift to hypoxia (1% O2) for 48h measured by ultra-performance liquid chromatography - tandem mass spectrometry; n = 4/group.
(e) Schematic representation of phosphoinositol signalling and the metabolic fate of PI(4,5)P2. PM: plasma membrane. PI: phosphatidylinositol, PI4P: phosphatidylinositol-4-phosphate, PtdIns(4,5)P2: phosphatidylinositol-4,5-biphosphate, PI(3,4,5)P3: phosphatidylinositol-3,4,5-trisphosphate.
(f) HIF1a mRNA expression level in A549 cells (relative to normoxia control at 24h). Cells were transduced with either an empty vector (Tet-pLKO-puro, shControl) or a doxycycline-inducible shRNA against HIF1α and incubated in normoxia or hypoxia for the indicated time; n = 3.
(g) Heatmap display of PI(4,5)P2 lipid alterations (fold change). A549 cells were transduced with either an empty vector control (Tet-pLKO-puro, shControl) or a doxycycline-inducible shRNA against PLCγ1, treated with doxycycline for 48h and treated as in (a); n = 4/group.
(h) Peak areas of the indicated PI(4,5)P2 lipid species in A549 cells from (g); n = 4/group.
(i) Total PI(4,5)P2 peak areas in A549 cells treated as in (g); n = 4/group.
All graphical data are presented as mean ± SD. Statistical analyses were done using two-tailed unpaired Student’s t test or one-way ANOVA; n, number of biologically independent samples. * p < 0.05, ** p < 0.01, *** p < 0.001, **** p < 0.0001. Statistical source data are provided in Source Data Extended Data Fig. 1.

