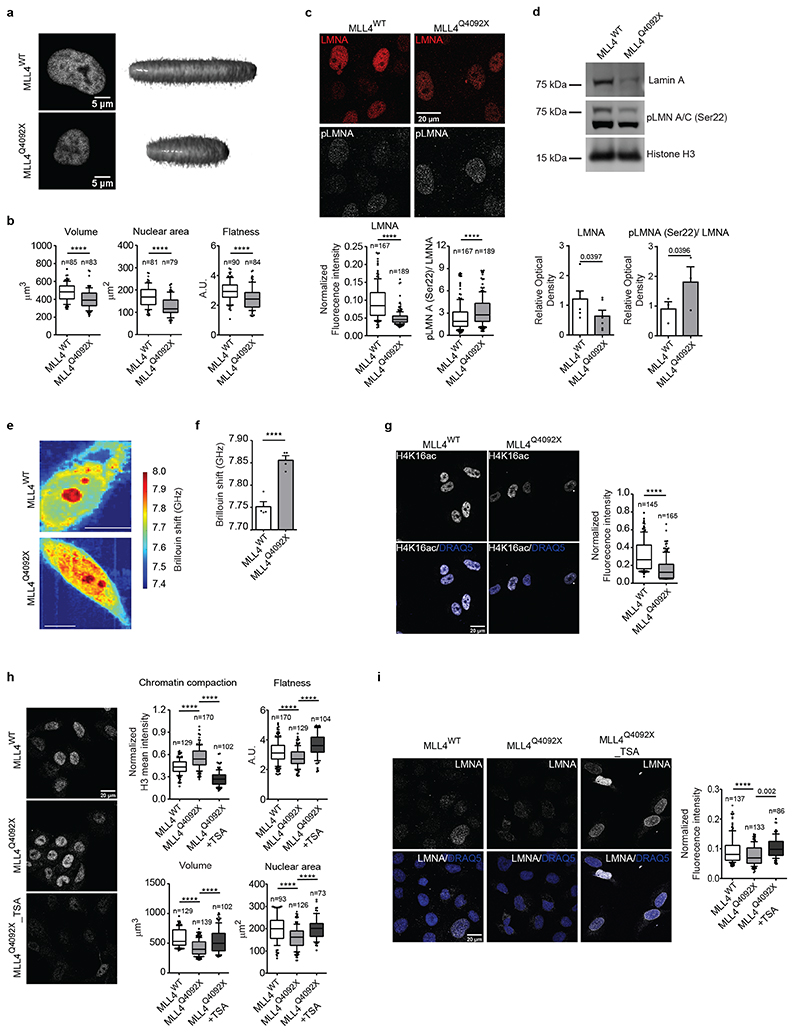
Fig. 5. MLL4 contributes to establish nuclear mechanical properties.
a High magnification images of nuclei of WT and MLL4Q4092X MSCs and reconstructed 3D images of nuclear shape. Scale bar, 5 μm.
b Quantification of nuclear volume, nuclear area and flatness of WT and MLL4Q4092X MSCs. Box plots indicate the median (middle line), the first and third quartiles (box), and the 10th and 90th percentile (error bars). The number of analyzed nuclei is reported in figure (n). Unpaired two-tailed Student’s t-test was applied for statistical analysis (**** P < 0.0001).
c Representative images and relative quantifications of immunostaining for LMNA/C and LMNA/C phosphorylated on Ser22 (pLMNA) in WT and MLL4Q4092X MSCs. Scale bar, 20 μm. Box plots indicate the median (middle line), the first and third quartiles (box), and the 10th and 90th percentile (error bars). The number of analyzed nuclei is reported in figure (n); unpaired two-tailed Student’s t-test was applied for statistical analysis (**** P < 0.0001).
d Western Blot analysis of LMNA and pLMNA/C in WT and MLL4Q4092X MSCs; histone H3 was used as loading control. Data are means + SEM of 6 independent experiments for LMNA and 3 independent experiments for pLMNA; unpaired one-tailed Student’s t-test was applied for statistical analysis.
e Representative maps of stiffness distribution in WT and MLL4Q4092X MSCs acquired with the Brillouin microscope: a higher Brillouin shift corresponds to stiffer portions of the cells. Scale bars, 10 μm.
f Bar plot representing nuclear Brillouin shift in WT and MLL4Q4092X MSCs. Data are means + SEM (n = 5 independent experiments); Student’s t-test was applied for statistical analysis (**** P < 0.0001).
g Representative images and relative quantifications of immunostaining for H4K16ac in WT and MLL4Q4092X MSCs. Scale bar, 20 μm. Box plots indicate the median (middle line), the first and third quartiles (box), and the 10th and 90th percentile (error bars) of the fluorescence intensity. The number of analyzed nuclei is reported in figure (n). Unpaired two-tailed Student’s t-test was applied for statistical analysis (**** P < 0.0001).
h-i Representative images and relative quantifications of nuclear physical properties (h) and Lamin A/C (i) in WT and MLL4Q4092X MSCs, untreated or treated with TSA (1.5 μM for 24 h). The relative level of chromatin compaction was determined as the ratio of the sum intensity of H3 signal, with respect to the nuclear volume. Scale bar, 20 μm. Box plots indicate the median (middle line), the first and third quartiles (box), and the 10th and 90th percentile (error bars). The number of analyzed nuclei is reported in figure (n). Unpaired two-tailed Student’s t-test was applied for statistical analysis (**** P < 0.0001).

