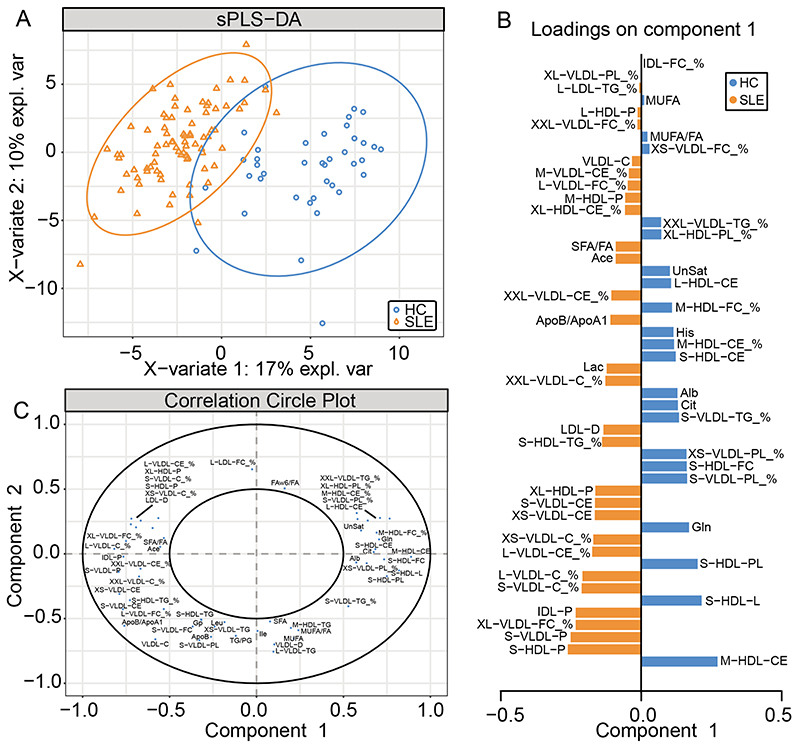
Figure 2. Partial least squares discriminate analysis able to differentiate SLE patients from HC.
Metabolomic data from 80 patients with SLE and 39 healthy controls (HC) were analysed using a NMR platform. (A) sPLS-DA performed on 50 metabolic markers following model optimisation separated SLE patients from healthy controls. (B) Features included in the sPLS-DA are plotted with their factor loading value. (C) Visualisation of the weighting and correlation of each metabolite in component 1 and 2 on the sPLS-DA model. Abbreviations: HDL, high density lipoprotein: LDL, low density lipoprotein: VLDL, very low density lipoprotein: IDL, intermediate density lipoprotein: XXL, chylomicrons and extremely large: XL, very large: L, large: M, medium: S, small: XS very small: PL, phospholipids: C, total cholesterol: CE, cholesterol esters: FC, free cholesterol: TG, triglycerides: P, particle: D, diameter: see Supplementary Table III for full list of metabolite abbreviations).

