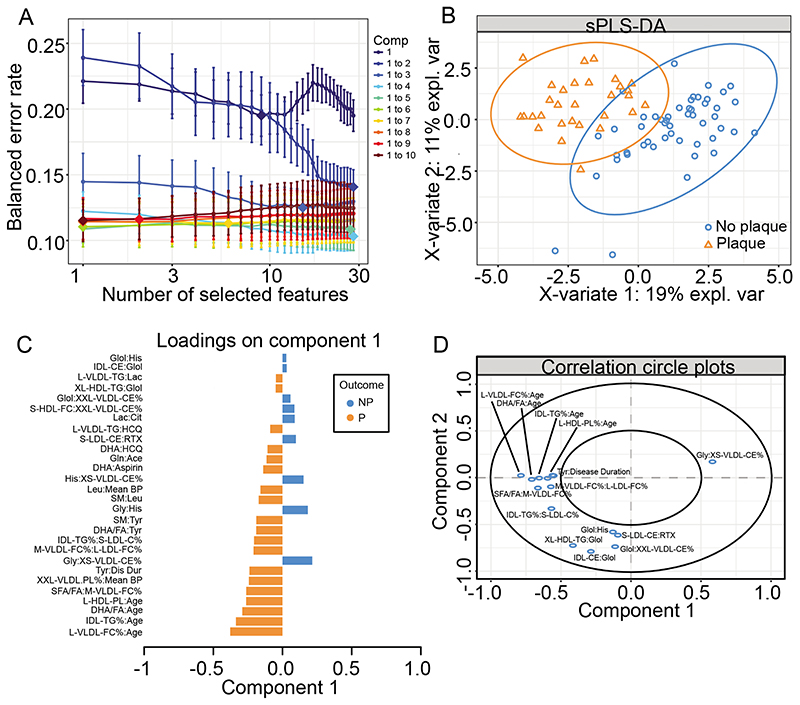
Figure 4. Partial least squares discriminate analysis validated metabolites identified by logistic regression with interactions to predict SLE-P.
(A) Model optimisation – model with different components and features kept in the analysis were analysed, with each colour representing a different number of components (Comp), number of features kept in the analysis on the x-axis, and the overall error on the y-axis. (B) sPLS-DA plot to validate top hits from the logistic regression with interactions. sPLS-DA is a supervised clustering method which separates SLE-P from SLE-NP. (C) Features included in the sPLS-DA plotted with their factor loading value. (D) Visualisation of the weighting and correlation of each metabolite in component 1 and 2 on the sPLS-DA model. See Supplementary Table III for metabolite abbreviations.

