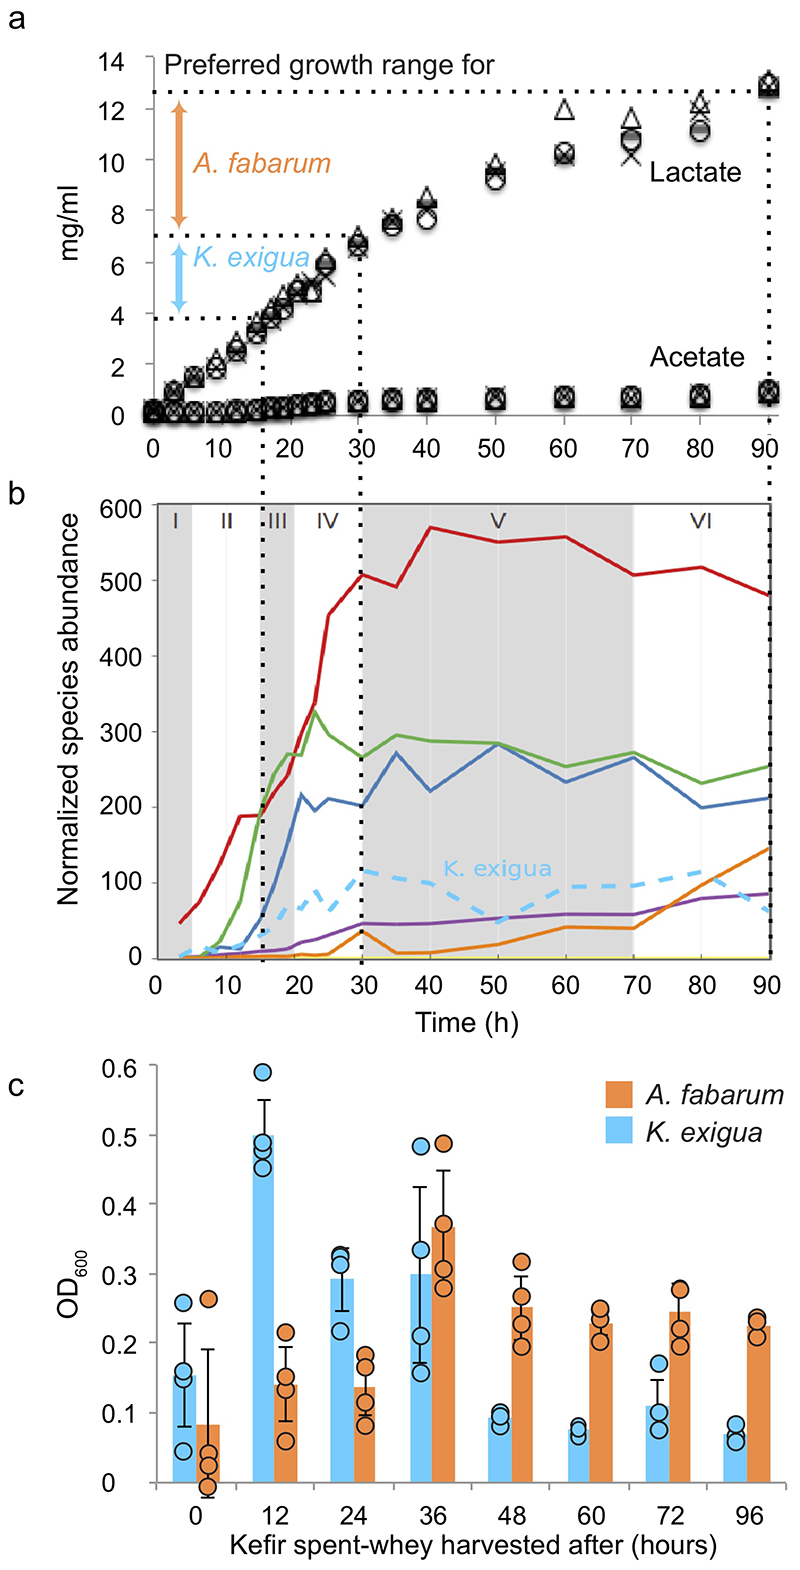
Extended Data Fig. 5. Lactate concentration shapes consecutive time-windows of growth of Kazachstania exigua (yeast) and Acetobacter fabarum .
a, Evolution of lactate and acetate concentration during kefir fermentation. Different symbols mark data from replicates (N=4). Colored block arrows indicate optimal lactate concentration ranges for the K. exigua and A. fabarum (Fig. 3d). Dotted lines connect the time-windows corresponding to these concentration ranges to the time-windows in panel B. b, Growth of kefir species over time with dotted lines marking the time-windows corresponding to the lactate concentration ranges from (a). c, Growth of K. exigua and A. fabarum in kefir spent whey harvested at different time points (N=4 biologically independent samples; error bars = SD). Data are presented as mean values +/- SD.

