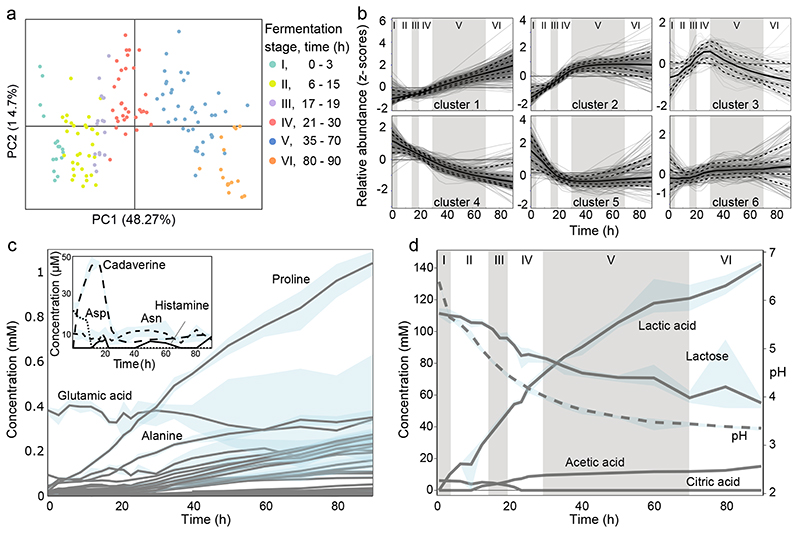
Fig. 2. Metabolite changes during kefir fermentation depict niche dynamics.
a, Principal component analysis of untargeted metabolomics data shows sequential changes in the milk fraction. Samples are colored according to the six fermentation stages as determined by species dynamics (Fig. 1d). b, Changes in metabolite ions during fermentation reveals diverse patterns including continuous utilization (cluster 4) and bell-shaped pattern suggestive of cross-feeding (cluster 3). All ions detected by FIA-qTOF MS were grouped into 6 clusters via k-means clustering (Methods). Solid line, median values of the ions in each cluster; dashed lines, 10%, 25%, 75%, and 90% of the metabolites, respectively. The six fermentation stages are marked by roman numerals. For a-b, average values are shown from eight replicates (four biological replicates, each with two technical replicates). Quantitative assessment of c, free amino acids and polyamines, and d, carbohydrates and organic acid changes during kefir fermentation suggest major role of the depicted metabolites in orchestrating species dynamics. For c-d, average values are shown from four biological replicates. The blue shaded areas in c and d, indicate the data range. The molecules shown in the inlay of c are present at low concentrations. Only a small amount of histamine is produced during kefir fermentation, and though cadaverine – an undesired by-product - accumulated early on, its concentration dropped to very low levels by 24 h.

