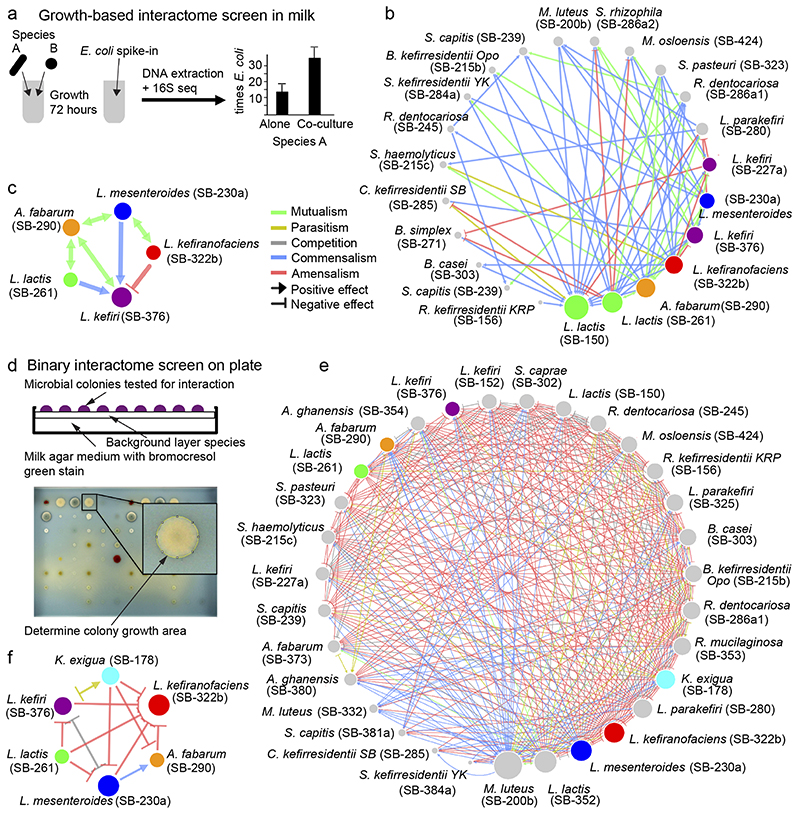
Fig. 4. Interactions between kefir community members are extensive and qualitatively differ between solid and liquid phases.
a, Schematic of the method used to assess growth-promoting or growth-inhibiting interactions between kefir species in milk. Species abundance in mono- and co-cultures was assessed via 16S amplicon sequencing with quantitative E. coli spike-in. b-c, Kefir species (b – all tested species, c – abundant species) exhibit predominantly positive (commensal and mutualistic) interactions in milk. In b-c, data are based on three biological replicates. d, (Top) Schematic of the method used to detect species interactions on milk plates (Methods). Each species was plated as a background layer on milk plates containing bromocresol green; all query species were pinned on top. (Bottom) Colony area was assessed as a growth metric. e-f, Kefir species (e – all tested species, f – abundant species) exhibit predominantly negative interactions on milk plates. Node size represents the number of interactions with other species. Data are based on at least four biological replicates for each interaction pair.

