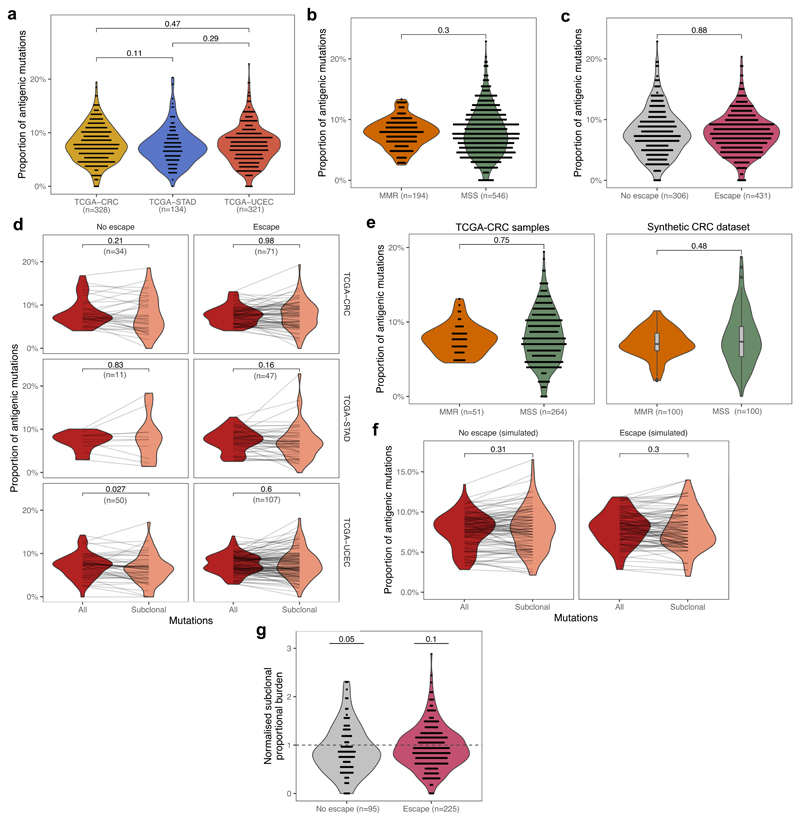
Extended Data Fig. 6. Proportional burden of TCGA tumours.
(a) Inter-tumour distribution of the antigenic proportion of missense mutations across CRC, STAD and UCEC cancers with >30 missense mutations. (b) Inter-tumour distribution of proportional burden in MSS and MMR cancers of the meta-cohort combining CRC, STAD and UCEC cancers with >30 missense mutations. (c) Inter-tumour distribution of proportional burden in escaped and non-escaped cancers of the meta-cohort. Two-sided Wilcoxon test p-values are reported on a-c (d) Proportional burden computed for all (red) and subclonal (salmon) mutations in immune-escaped and non-escaped samples of each TCGA cohort. Lines connect values computed from the same cancer. (e) Inter-tumour distribution of proportional burden in real CRC samples stratified by MSS/MMR status (left) and synthetic samples matching the mutational composition of real samples (right), with two-sided Wilcoxon-test reported on top. (f) Total and subclonal proportional antigen burden computed on a matched synthetic cohort of n=100 tumours (cf. Fig. 5c). The p-value of paired two-sided Wilcoxon test is reported on (d) & (f). (g) Normalised proportional subclonal burden computed by dividing subclonal burden of the meta-cohort by average subclonal burden of the synthetic cohort of n=100. P-value of a one-sample two-sided t-test against null-hypothesis of mean=1 is reported above each violin. Violin widths represent raw data density with binned individual data-points overlaid on top in (a-d) & (g) and indicated by the end-points of connecting lines in (e-f). Visual elements of boxplots in (d) correspond to the following summary statistics: centre line, median; box limits, upper and lower quartiles; whiskers, 1.5x inter-quartile range; additional points, outliers outside of 1.5x inter-quartile range.

