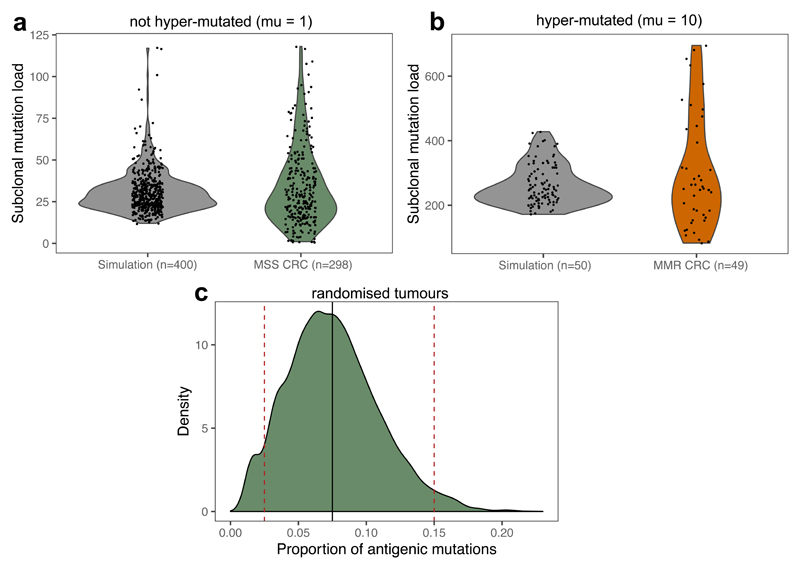
Extended Data Fig. 7. Values of μ and pa based on TCGA CRCs.
(a-b) The number of subclonal (CCF < 0.6) missense mutations in MSS (a) and MMR (b) CRC samples; shown together with the subclonal mutation count of ‘normal’ (a) and hyper-mutated (b) simulated tumours sequenced at a depth of 30-60x (sequencing depth sampled randomly in the range). Violin widths represent raw data density with individual data-points (of exact y values) scattered on top. (c) The distribution of the proportion of antigenic mutations in a randomised TCGA MSS colon dataset, where patient mutation load and HLA types were extracted from the data and the proportion of antigenic mutations calculated by sampling randomly from missense mutations found in TCGA CRCs. The thick solid black line shows pa=0.075, the values used for simulations presented in main figures. Dashed red lines show pa=0.025 and pa=0.15 used in Extended Data Fig. S9.

