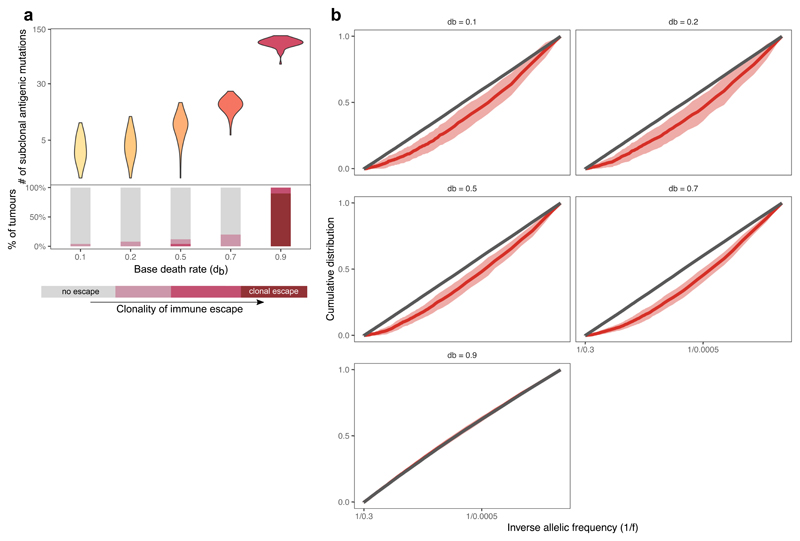
Extended Data Fig. 8. Immune properties of tumours at different basal death rates.
(a) The number of detectable neoantigen-associated mutations (at simulated sequencing depth of ~50x) in n=50 simulated tumours with increasing base (non-immunogenic) death rate. The bottom panel shows the ratio of tumours with different levels of immune escape. Violin widths represent raw data density. (b) Cumulative VAF distribution as a function of the inverse of the frequency, for all mutations (grey) and antigenic mutations (red) at increasing base death rate, db. The thick line shows the mean of n=100 simulated cumulative distributions, the shaded regions represent ±1 standard deviation around this mean. At very high base death (last panel), the VAF distribution of neoantigens and neutral mutations overlaps as tumours are exclusively immune-escaped and evolve neutrally.

