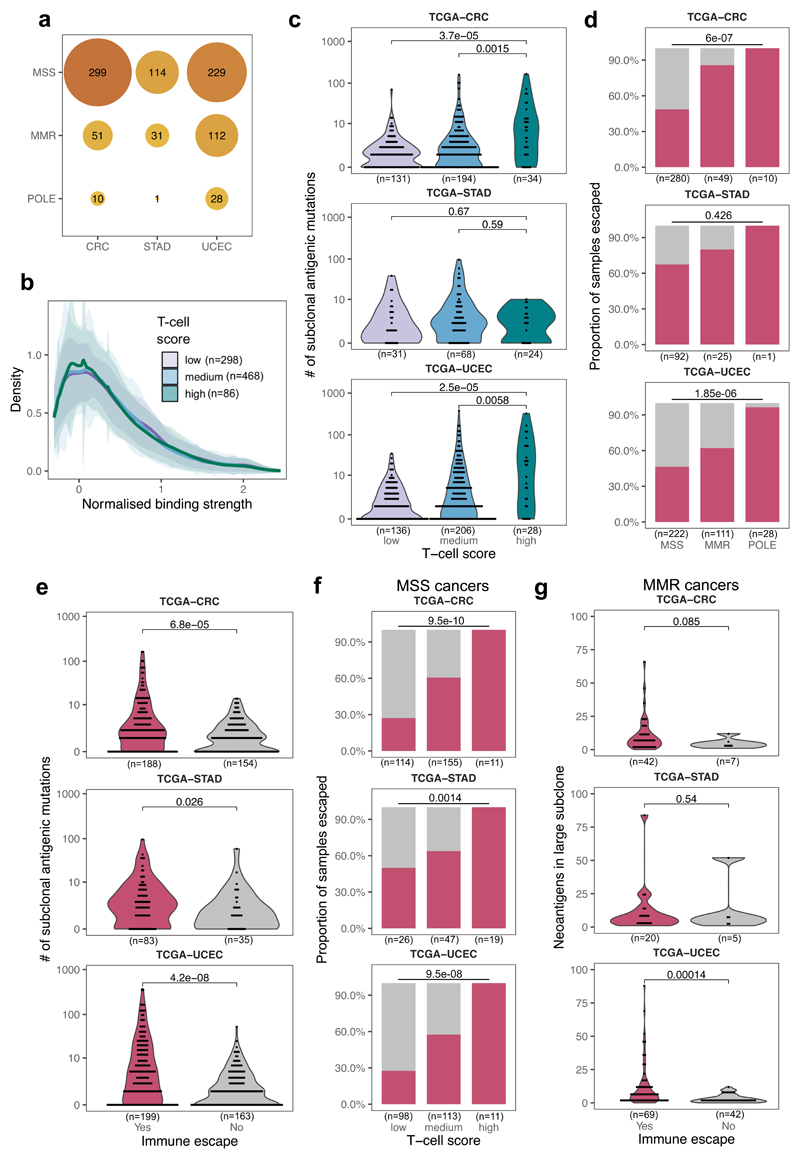
Figure 2. Colorectal, stomach and endometrial tumors from TCGA are antigen-hot and enriched for immune escape.
(a) Cancer type and mutator subtype of the TCGA cancers analyzed. The size and shade of each circle represent the number of tumors (also shown) in that sub-category. (b) Distribution of normalized binding strength of neoantigens in TCGA cancers with low, medium and high immune infiltration. The thick line shows the mean density of all distributions from tumors in each category, the shaded regions represent ±1 standard deviation around this mean. (c) Distribution of the number of subclonally detected (in <60% of the tumor) neoantigen-associated mutations in cancers according to immune infiltration (T-cell average) score. Two-sided Mann-Whitney tests are reported on each plot. (d) Prevalence of immune escape in MSS, MMR and POLE samples. Two-sided chi-squared test is indicated on top of each panel. (e) Distribution of the number of subclonal antigenic mutations in cancers with and without immune escape (magenta and grey, respectively) Two-sided Mann-Whitney test is reported on each panel. (f) Prevalence of immune escape in MSS cancers according to their immune infiltration level. Two-sided chi-squared test is indicated on top of each panel. (g) Number of antigenic mutations present in large subclones (>30% and <60% of cells) in MMR samples with and without immune escape. One-sided Mann-Whitney test is reported above each plot. Violin widths in (c), (e) & (g) represent raw data density with binned individual data points overlaid on top.

