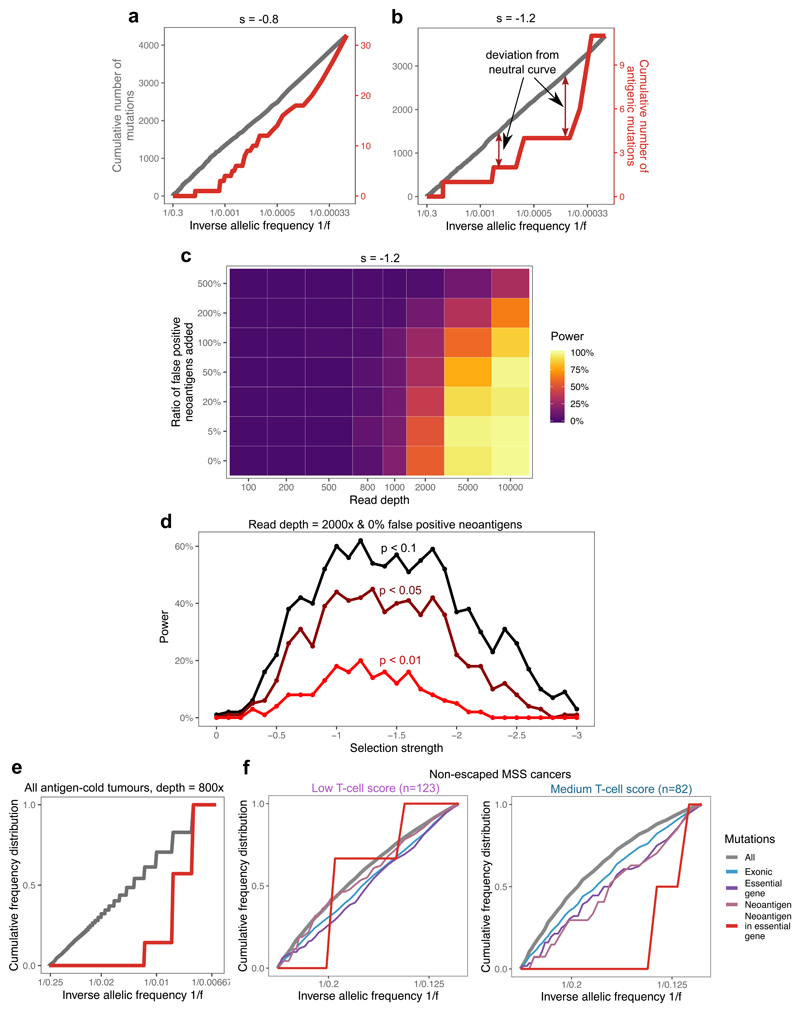
Figure 4. Negative selection leads to characteristic depletion of neoantigens and effectively-neutral overall VAF distributions.
(a-b) Cumulative number of mutations as a function of the inverse of the frequency for all mutations (grey, left axis) and neoantigen-associated mutations (red, right axis) harbored in at least 30 cells in (a) a tumor with s=-0.8; (b) a tumor with s=-1.2. (c) Power to detect negative selection from the VAF distribution as a function of sequencing read depth (x axis) and false neoantigen rate (y axis). Power is the proportion of 100 simulated tumors with significant difference (two-sided Kolmogorov-Smirnov test, α=0.1) between the distribution of all mutations and neoantigen-associated mutations. (d) Power (in n=100 tumors) to identify negative selection as a function of selection strength (x axis) and the stringency of the two-sided Kolmogorov-Smirnov test used for detection (α=0.1, α=0.05, and α=0.01, shown in black, maroon and red, respectively). (e) Cumulative VAF distribution as a function of the inverse of the frequency for all (in grey) and neoantigen-associated mutations (in red) detected with a sequencing depth of 800x in antigen cold tumors from a simulated set of n=100. The y axis shows proportion of mutations. The mutation-antigenicity threshold 0.2 is used in all cases in (a)-(e). (f) Cumulative VAF distribution of mutations detected in any low- and medium-immune infiltrated TCGA MSS cancers without immune escape. The distribution is shown for all mutations (grey), exonic mutations (blue), exonic mutations in essential genes (purple), antigenic mutations (pink) and neoantigen-associated mutations in essential genes (red).

