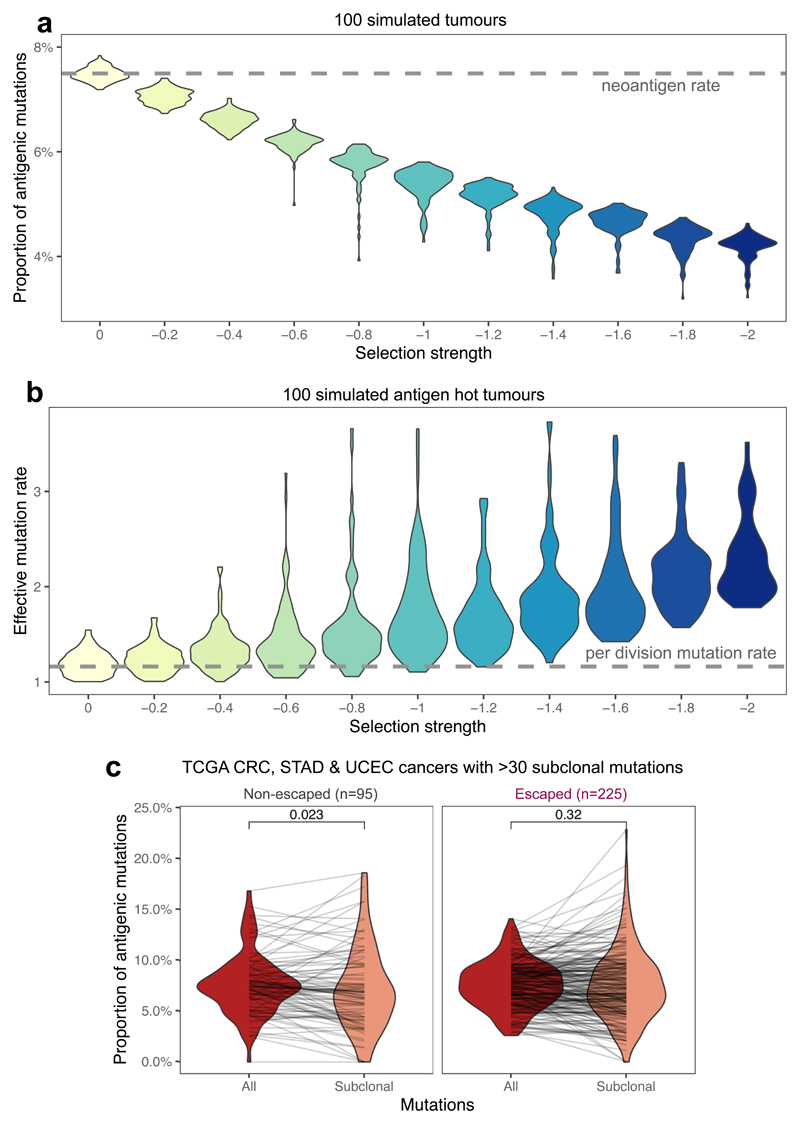
Figure 5. Proportional neoantigen burden as a measure of selection.
(a) The proportion of neoantigen-associated mutations (the percentage of all mutations) as a function of negative selection pressure, computed from n=100 tumors each, with a simulated read depth of 200x. The expected value of antigens per mutation is indicated with a horizontal dashed line. The mutation-antigenicity threshold of 0.2 is used. (b) Effective mutation rate (per cell division mutation rate divided by per cell division death rate) computed from the VAF distribution of mutations in antigen-hot tumors as a function of negative selection pressure. Read depth = 200x. Colors in (a) & (b) indicate selection strength also shown on x axis (c) Proportional neoantigen burden of escaped and non-escaped TCGA samples, computed from all mutations (red) and only subclonal mutations (CCF<0.6, colored salmon). Lines connect total and subclonal proportional burdens measured in the same sample. Paired two-sided Wilcoxon test is reported above the violin plots. Violin widths represent raw data density with individual data points in (c) also indicated by end-points of connecting lines.

