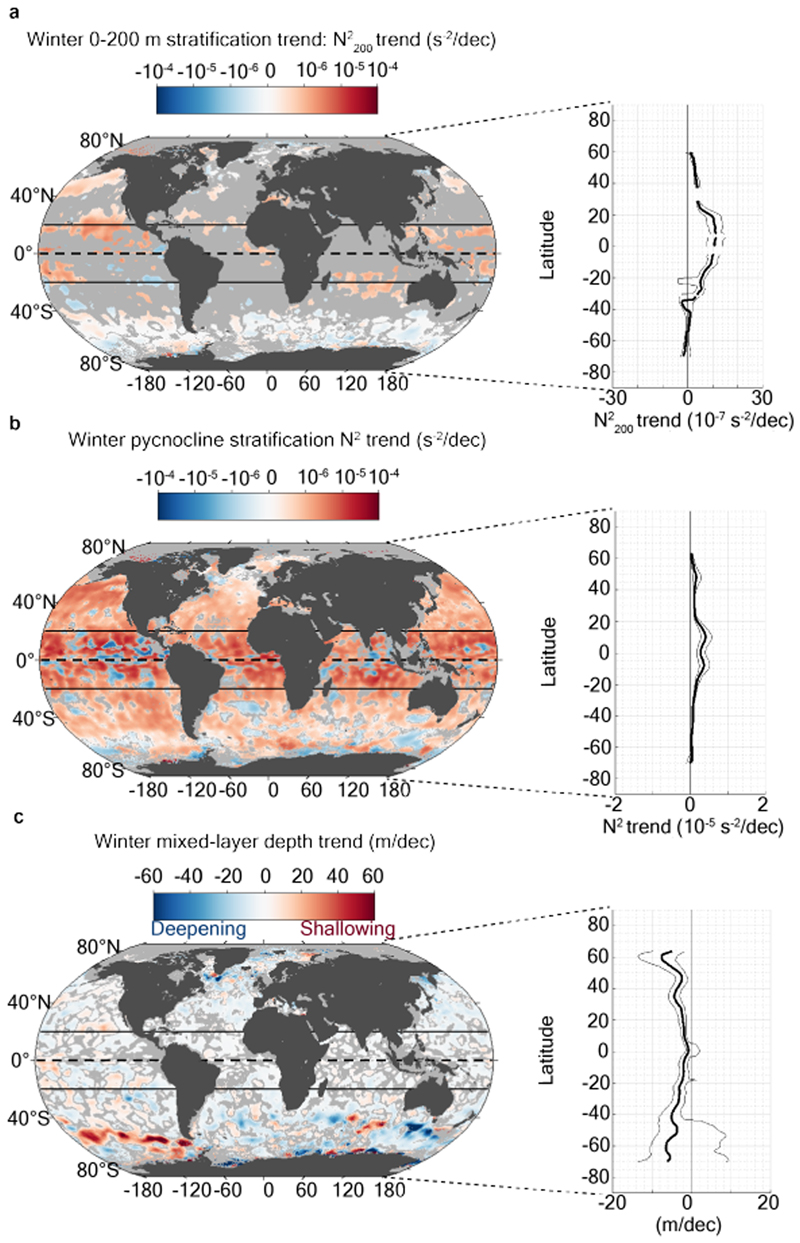
Extended Data Figure 5. 1970-2018 trends in winter upper-ocean stratification and mixed layer depth.
Map of the 1970-2018 winter (a) 0-200 m ( trend in s-2 dec-1), and (b) pycnocline stratification trend (i.e. N2 trend in s-2 dec-1), along with zonal-median value in bold black, and 33-66 percentile in thin black. Regions with no significant trend (see Methods) are shaded in gray on the map. (c) same as panel (a,b) but for winter mixed layer trend in m dec-1 (note that mixed layer deepening is shown as a negative trend).

