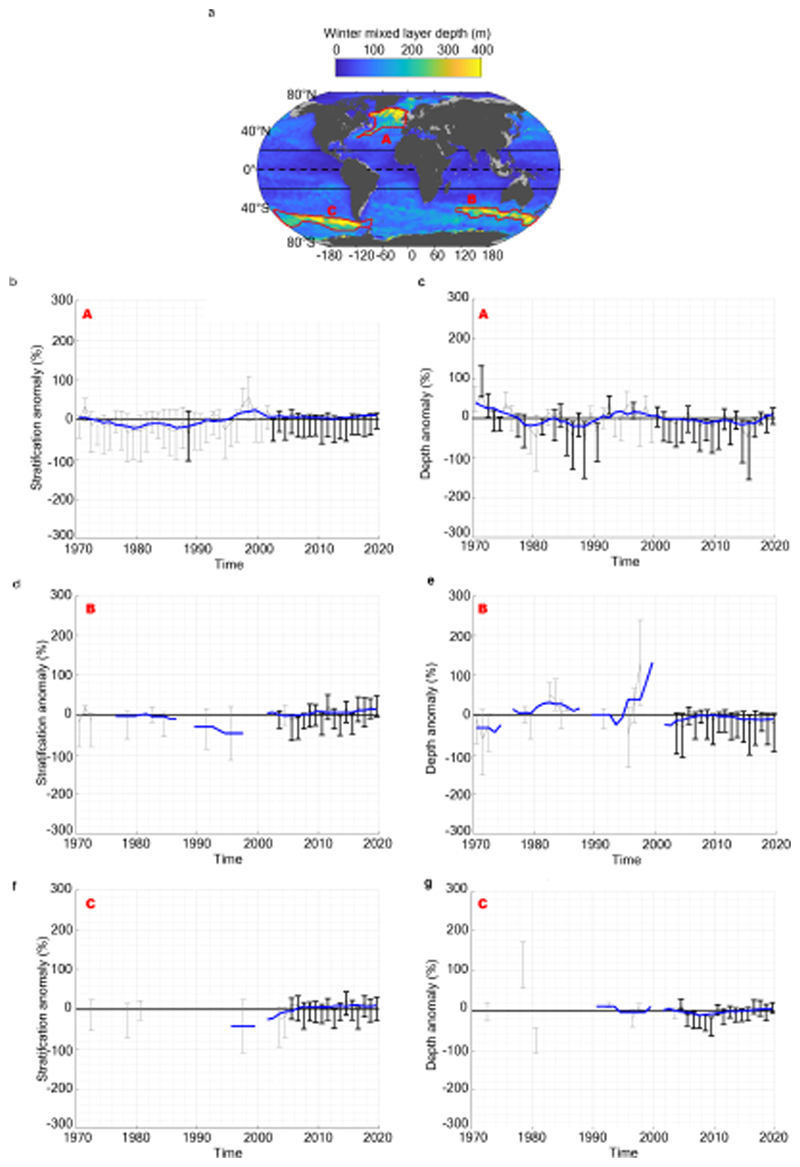
Extended Data Figure 6. Regional time series of winter pycnocline stratification and mixed layer depth anomaly.
(a) Winter climatological mixed layer depth, same as Fig. 2f, with three specific regions of interest outlined by red contours: North Atlantic subpolar convection region (A); Southern Ocean Indian sector convection region (B); and Southern Ocean Pacific sector convection region (C). For each of these regions, winter stratification anomaly times series and associated trends are respectively displayed in panels (b,d,f); and winter mixed layer depth anomaly times series and associated trends are respectively displayed in panels (c,e,g). Note that a negative depth anomaly refers to a deepening. Each times series panel shows: in thin gray line, the annual median percentage anomaly (from the local climatological seasonal cycle), computed for each individual observation; the errorbars refer to the 33-66 percentile range of percentage anomaly (errorbars are shown in black (gray) when more (fewer) than 50 data points are used in the annual statistics); the associated 5-year smoothed median time series is superimposed in blue; a linear trend from 1970-2018 is shown by the red line if greater than twice its standard error.

