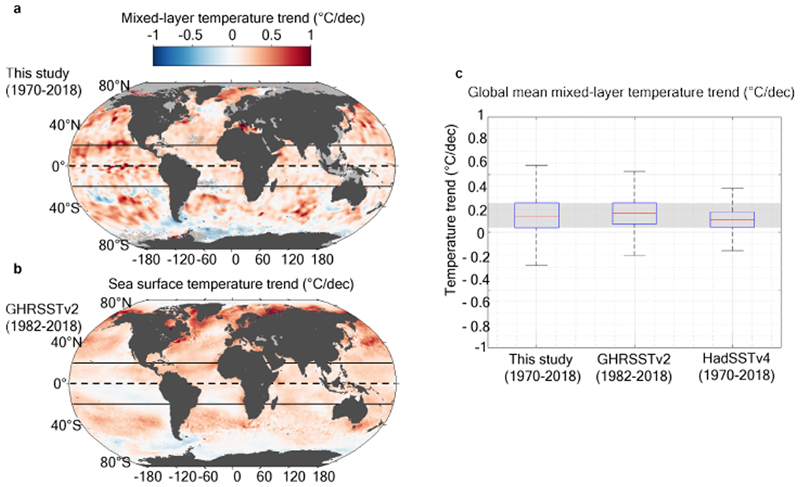
Extended Data Figure 7. Comparison between mixed-layer temperature trend and sea surface temperature trends.
(a) Summer mixed-layer mean temperature trend from 1970 to 2018 as estimated in this study; (b) Summer sea surface temperature trend from 1982 to 2018 as estimated from the satellite-based product GHRSSTv2, and (c) box plot showing median (red) and interquartile range (blue box) of local summer surface temperature trend estimates from this study (mixed-layer mean temperature from 1970-2018), from the satellite-based product GHRSSTv2 (sea surface temperature from 1982-2018), and from the in situ observation reconstruction product HadSSTv4 (sea surface temperature from 1970-2018). The whiskers extend to the most extreme data points

