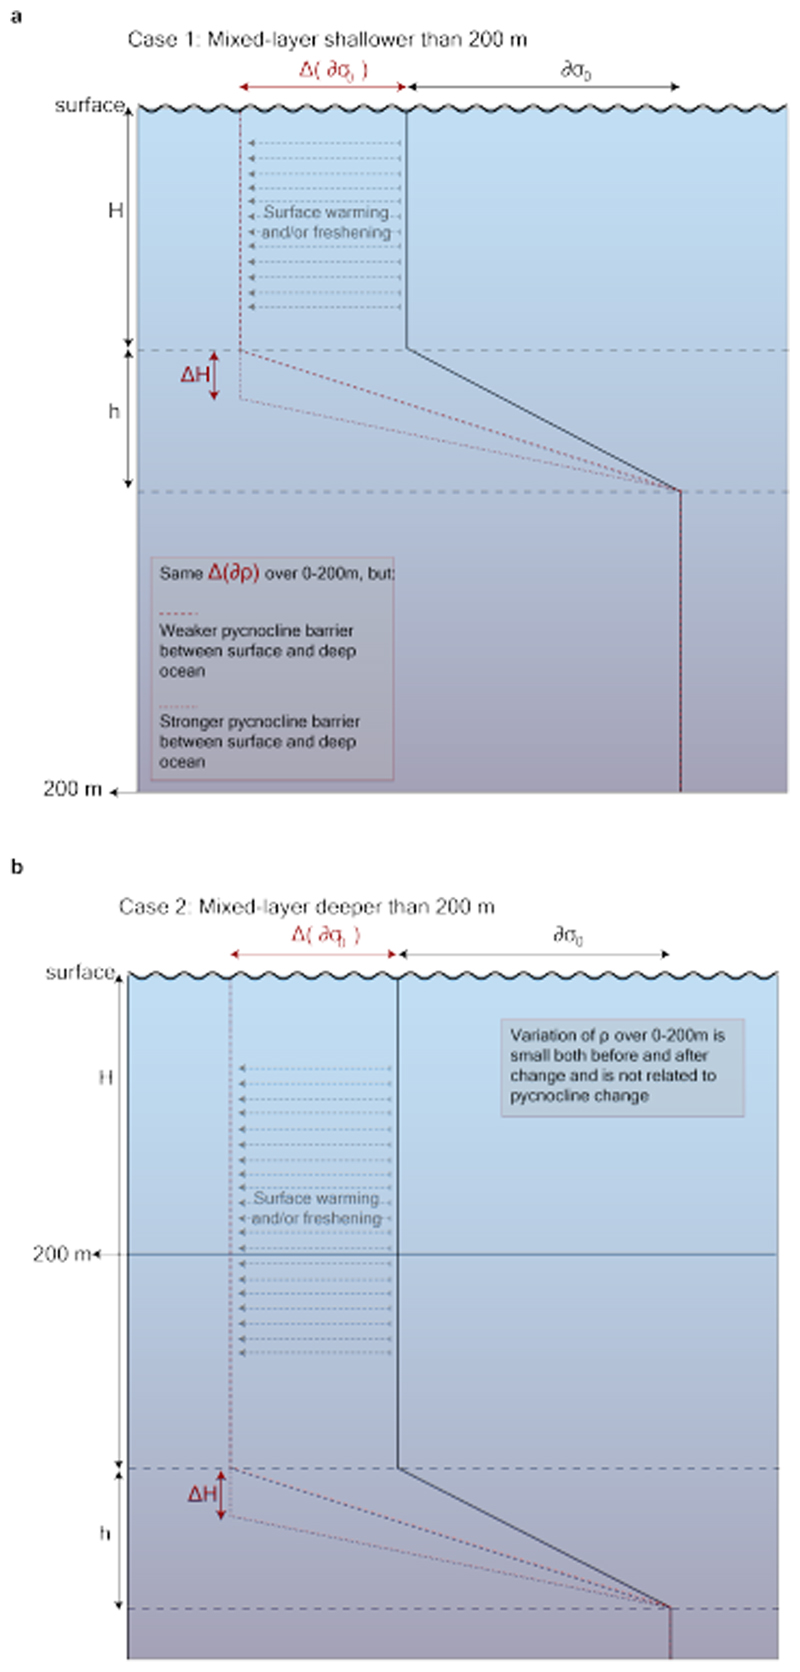
Extended Data Figure 1. Upper ocean vertical structure associated trends.
Schematics showing idealised density profiles in the upper ocean, for a case where mixed-layer and pycnocline are (a) shallower, and (b) deeper than 200 m. The black profile shows the typical shape of the density profile with a total density increase of ∂ρ across the pycnocline of thickness h, and a mixed-layer of thickness H. While the dashed red profiles show the density profile after a lightening of the mixed-layer, with no change of mixed-layer depth, the dotted red profiles show the density profile after a lightening of the mixed-layer, concomitant with a deepening of the mixed-layer.

