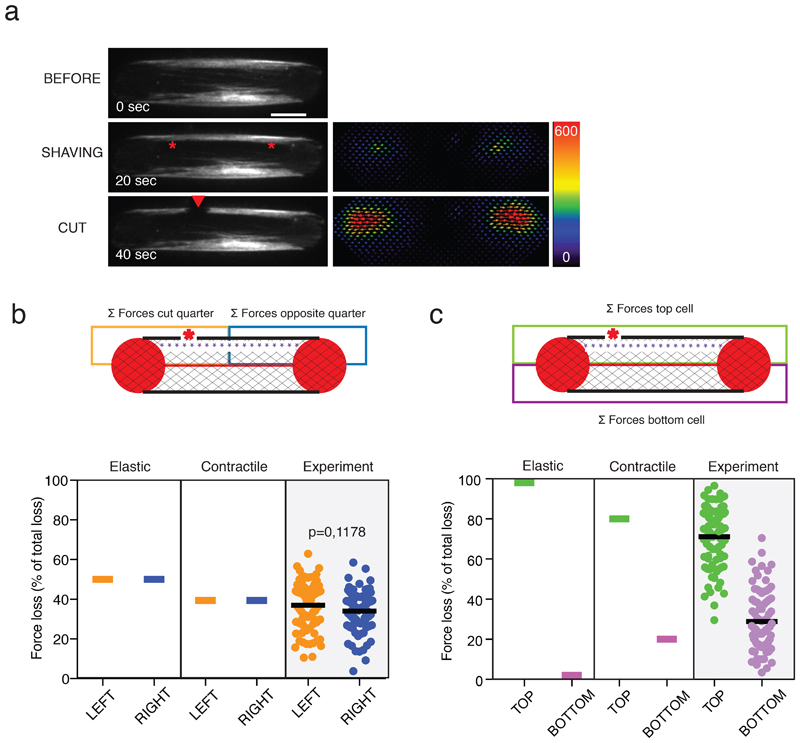
Extended Data Fig. 4. Elastic and contractile model predictions of the force loss distribution after stress fiber shaving and photoablation.
a. From top to bottom: Images of a representative RPE1-LA-GFP cell depicting the precut cell; a shaving; a consecutive cut together with the associated forces relaxed upon photoablation on the right panel. Image scale bar = 10 µm. Force scale bar in Pascal. N=3 experiments.
b. Spatial distribution of force loss along the stress fiber after stress-fiber shaving (purple dashed line) and off-center photoablation (red star). The loss of traction forces was considered in partitioned zones of the cell, where the orange zone included half the stress fiber and the off-centered photoablation site, and the blue zone included the other half of the stress fiber. Plot displaying the predictions of the elastic model, the contractile model and the experimental measurements (n=80 cells, N=14, mean is depicted). The p-value from a two-tailed paired t-test is indicated on the plot (p=0.1178).
c. Spatial distribution of force loss along the stress fiber after stress-fiber shaving (purple dashed line) and off-center photoablation (red star). The loss of traction forces was considered in partitioned zones of the cell, where the green zone included the stress fiber with photoablation site, and the purple zone included the stress fiber without photoablation. Plot displaying the predictions of the elastic model, the contractile model and the experimental measurements (n=80 cells, N=14, mean is depicted).

