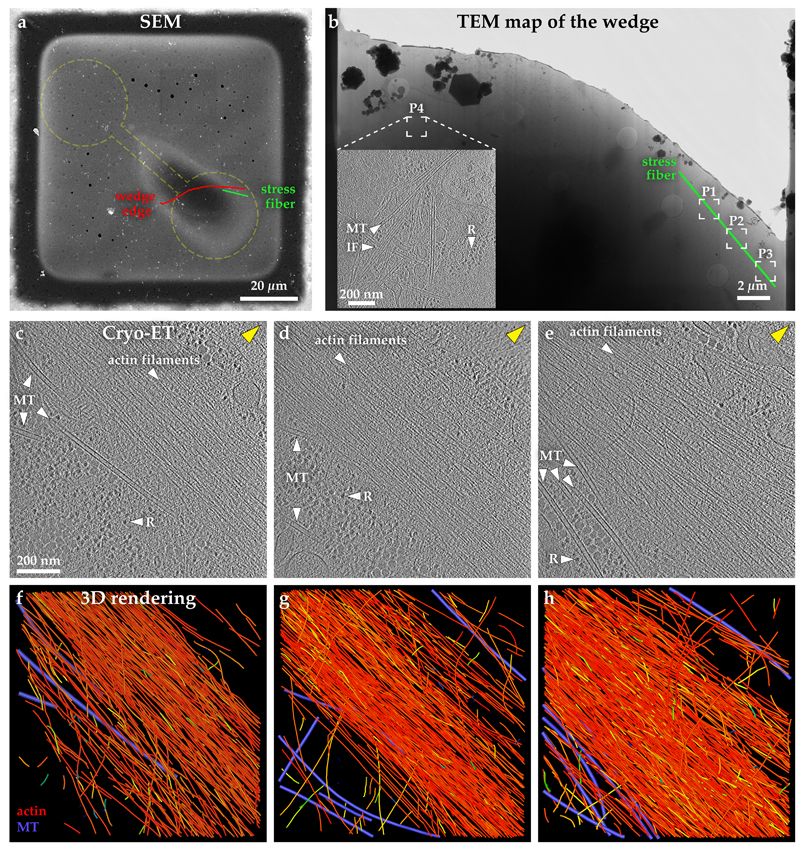
Extended Data Fig. 5. Actin filament organisation in 3D within and near the stress fiber.
a. Cryo-Scanning Electron Microscopy of a vitrified RPE cell adhered and spreading on a dumbbell-shape micropattern. Red line indicates the putative position of the edge of the wedge produced by cryo-FIB milling. The green line indicates the position of the stress fiber imaged by cryo-ET. The yellow dashed line represents the dumbbell shape pattern size and position.
b. Cryo-TEM of the wedge of the RPE cell shown in (a), displaying the positions (P1-P4) for cryo-ET. Inset: 6.8 nm thick tomographic slice of the P4 region. Microtubules (MTs); ribosomes (R); intermediate filaments (IF).
c-e. Cellular cryo-ET. Tomographic slices (6.8 nm thickness) of three positions - P1, P2 and P3 - in (b), respectively, along the same stress fiber. The three tomograms start at the basal membrane and extend the thickness of the tomograms towards the apical membrane. The distance between consecutive tomographed positions is ~ 2.5 µm (center-to-center of the tomograms), covering a total distance of ~7 µm. N=2 experiments.
f-h. 3D rendering of the actin filament network and microtubules (purple) from (c), (d), and (e), respectively. Blue-to-red color map of actin filaments represent the angular distribution (ranging from 0° to 90°) relative to the z-plane of the tomogram. Most actin filaments are positioned parallel to the basal membrane. See related Video 5.

