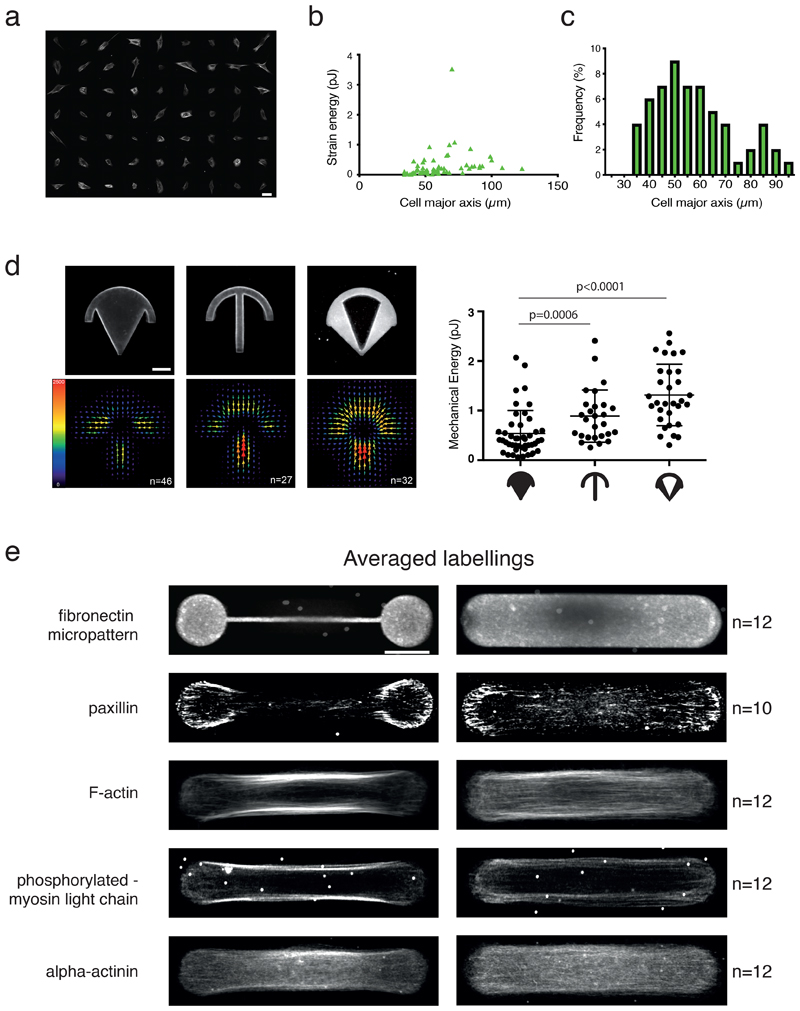
Extended Data Fig. 1. Variations of contractility with cell shape and architecture.
a. Actin filaments staining (SirActin 1 µM) of RPE1 live cells on homogeneous (non-micropatterned) fibronectin-coated poly-acrylamide gels. N=1 experiment. Scale bar=50 µm.
b. Variation of the strain energy associated to cell traction forces with respect to the length of non-micropaterned cells. n=63 cells, N=1 experiment
c. Distribution of the length of RPE1 cells on homogeneous (non-micropatterned) poly-acrylamide gels.
d. Traction-force maps of cells spread on various micropattern shapes. Upper images display the fibronectin coating on the micropatterns, and lower images show averaged traction-force maps of cells (scale bar in Pa). n-plain crossbow=46 cells, n-regular crossbow=27 cells, n-empty crossbow=32 cells, N=1 experiment. The graph shows the scatter plot of the mechanical energies on each micropattern and associated p-value (mean and standard deviation are depicted, two-tailed Mann-Whitney t-tests, p=0.0006 between plain and regular crossbow, p<0.0001 between regular and empty crossbow). 2 outliers were automatically removed from the analysis (remove outliers function of Prism).
e. Averaged localization of molecular components involved in cell contractility for cells displaying either two main peripheral stress fibers (when plated on dumbbell-shaped micropattern, left) or a continuous actin mesh (when plated on pill-shaped micropattern, right). For each shape, averaged Z projections of cells are displayed. From top to bottom: micropatterns labeling (fibrinogen-Cy5); actin (phalloidin-ATO-488); paxillin (alexa-488); phospho-MLC (CY3); alpha-actinin (CY3). Image scale bar = 10 µm. N=3 experiments.

