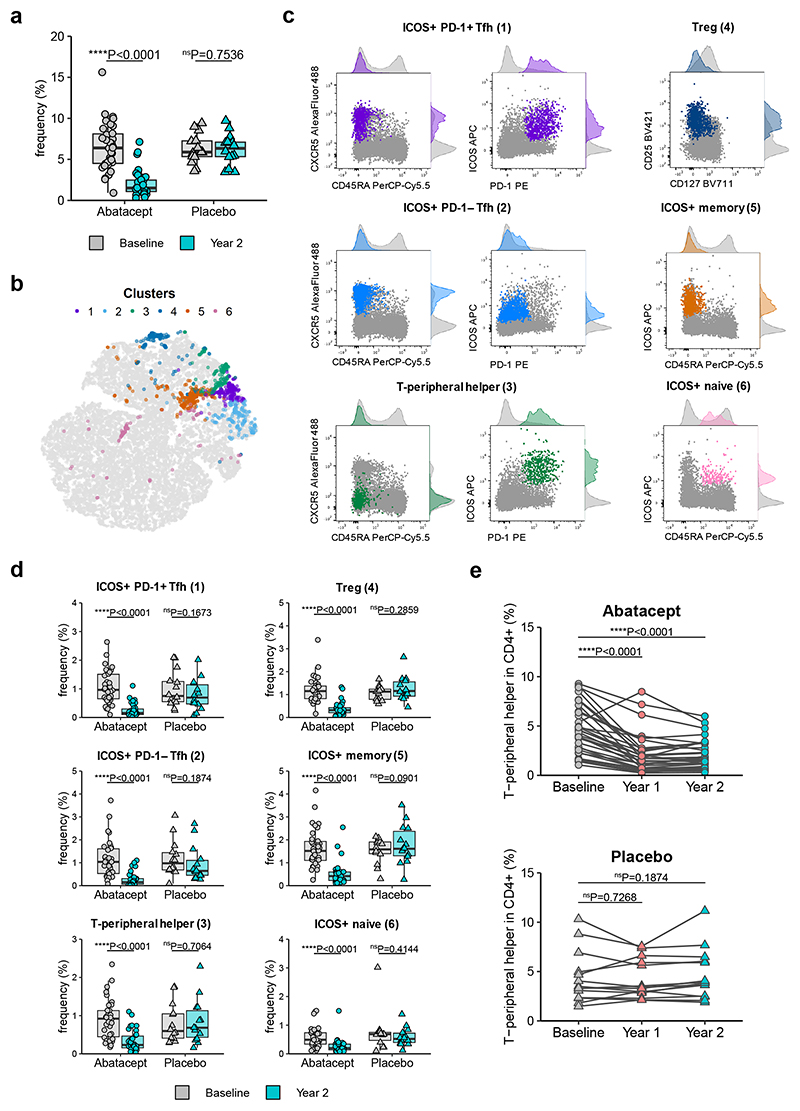
Figure 4. Data-driven analysis reveals additional Abatacept-sensitive populations in type 1 diabetes patients.
CellCnn analysis followed by k-means clustering of filter-specific cells was applied to flow cytometry data of samples taken at baseline and two years after Abatacept or placebo treatment initiation. (a) Frequency of filter specific cells in each analysed sample. (b) t-SNE projection of down-sampled, pooled flow cytometry data of all samples used for CellCnn analysis. K-means clusters of filter-specific cells are highlighted. (c) Representative flow cytometry overlays of cluster-specific cells (colour) on original flow cytometry data (grey). Examples shown are from a baseline sample. (d) Frequency of cluster-specific cells in each analysed sample. (e) Collated data for frequency of manually gated T-peripheral helper cells (ICOS+PD-1+CXCR5−CD45RA− in CD4+CD3+). Abatacept, n = 34 patients; Placebo, n = 13 patients (Year 1) or 14 patients (Baseline and Year 2). In (a) and (d) boxplots are shown with black horizontal line denoting median value, while box represents interquartile ranges (IQR, Q1-Q3 percentile) and whiskers show minimum (Q1– 1.5 * IQR) and maximum (Q3 + 1.5 * IQR) values. Two-tailed Wilcoxon signed-rank test; ****, p < 0.0001; ns, not significant.

